IoT-Powered Sustainability Management

Facilio organizes real-time sustainability insights, identifies inefficiencies and predicts consumption, while helping CREs achieve energy efficiency performance across portfolio.

Centralize your equipment and energy performance
Optimize energy efficiency in real-time
Portfolio-wide Enriched data
Real-time utility and
data analytics
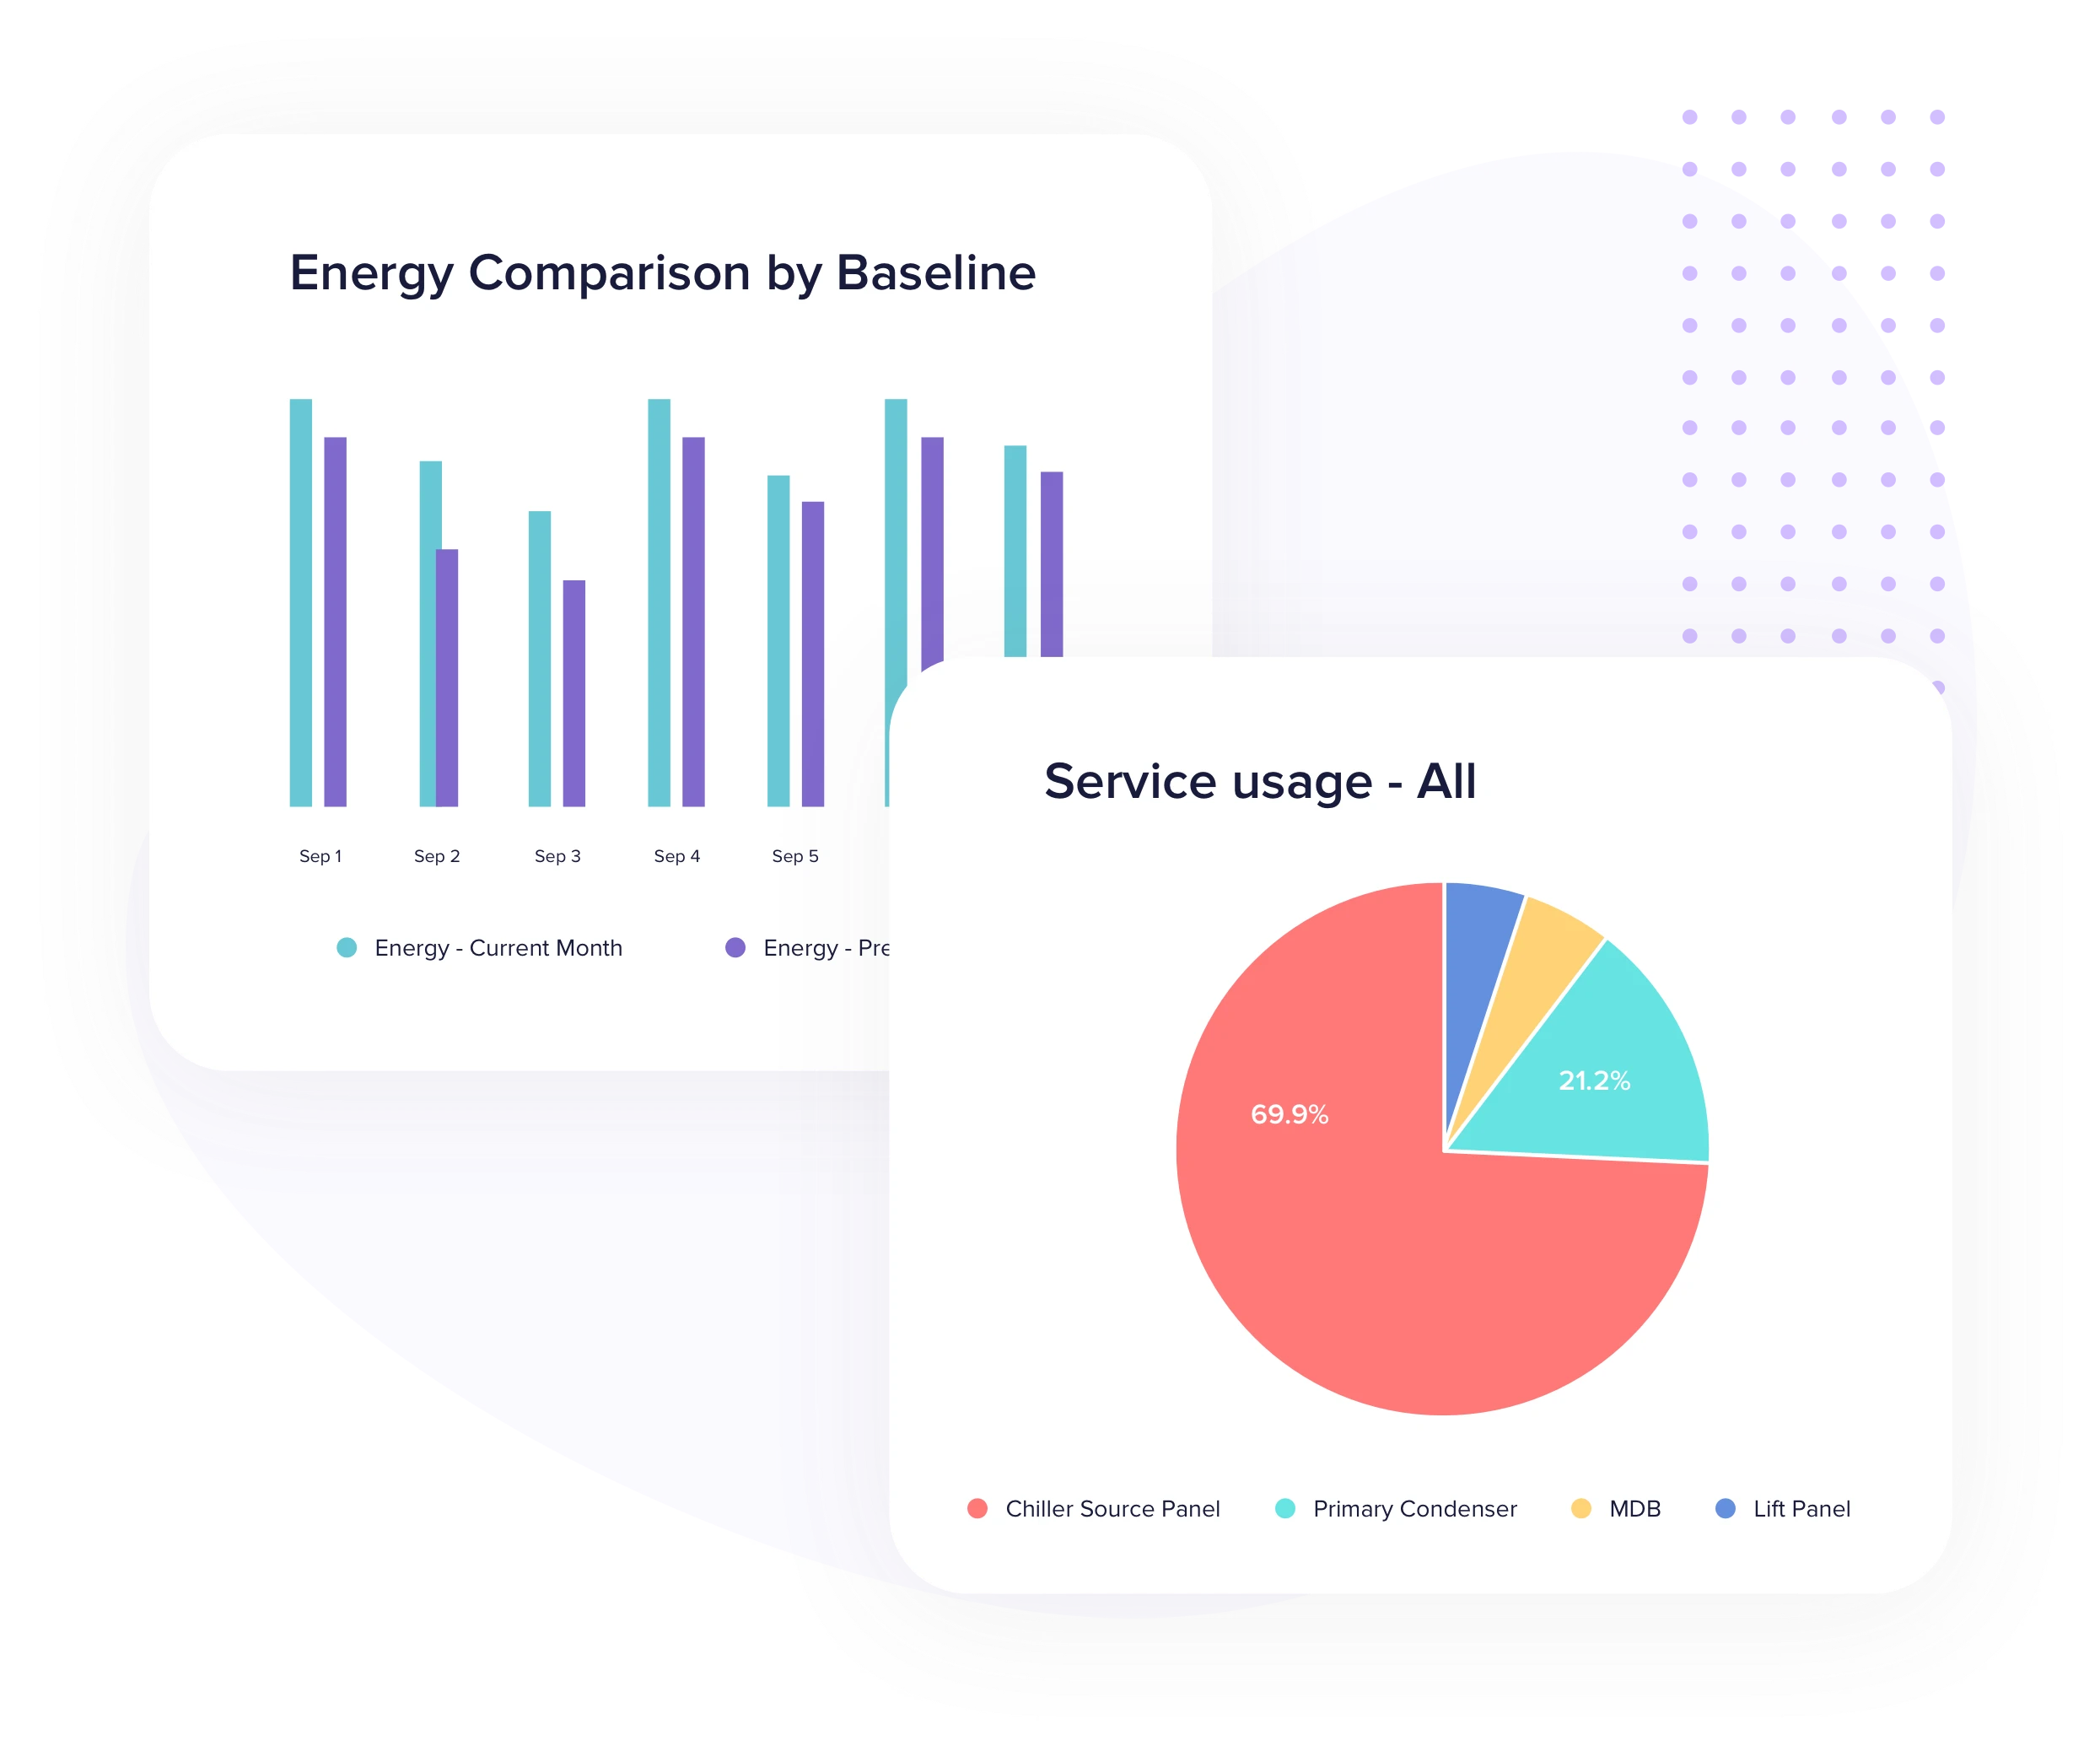
Decode crucial messages from comprehensive data acquired by IoT. Visualise insights like service usage by category, end-use breakdown, comparison with baseline, portfolio wide benchmarking in a variety of graphical formats that's readily available.
Engage stakeholders with portfolio-wide utility comparison stats and other enriching reports on a customizable dashboard. Stay aware of carbon emission tags and energy cost projection derived from AI.
Real-time utility
Accurately quantify energy
M&V Precision
Accurately quantify energy
savings for your retrofits
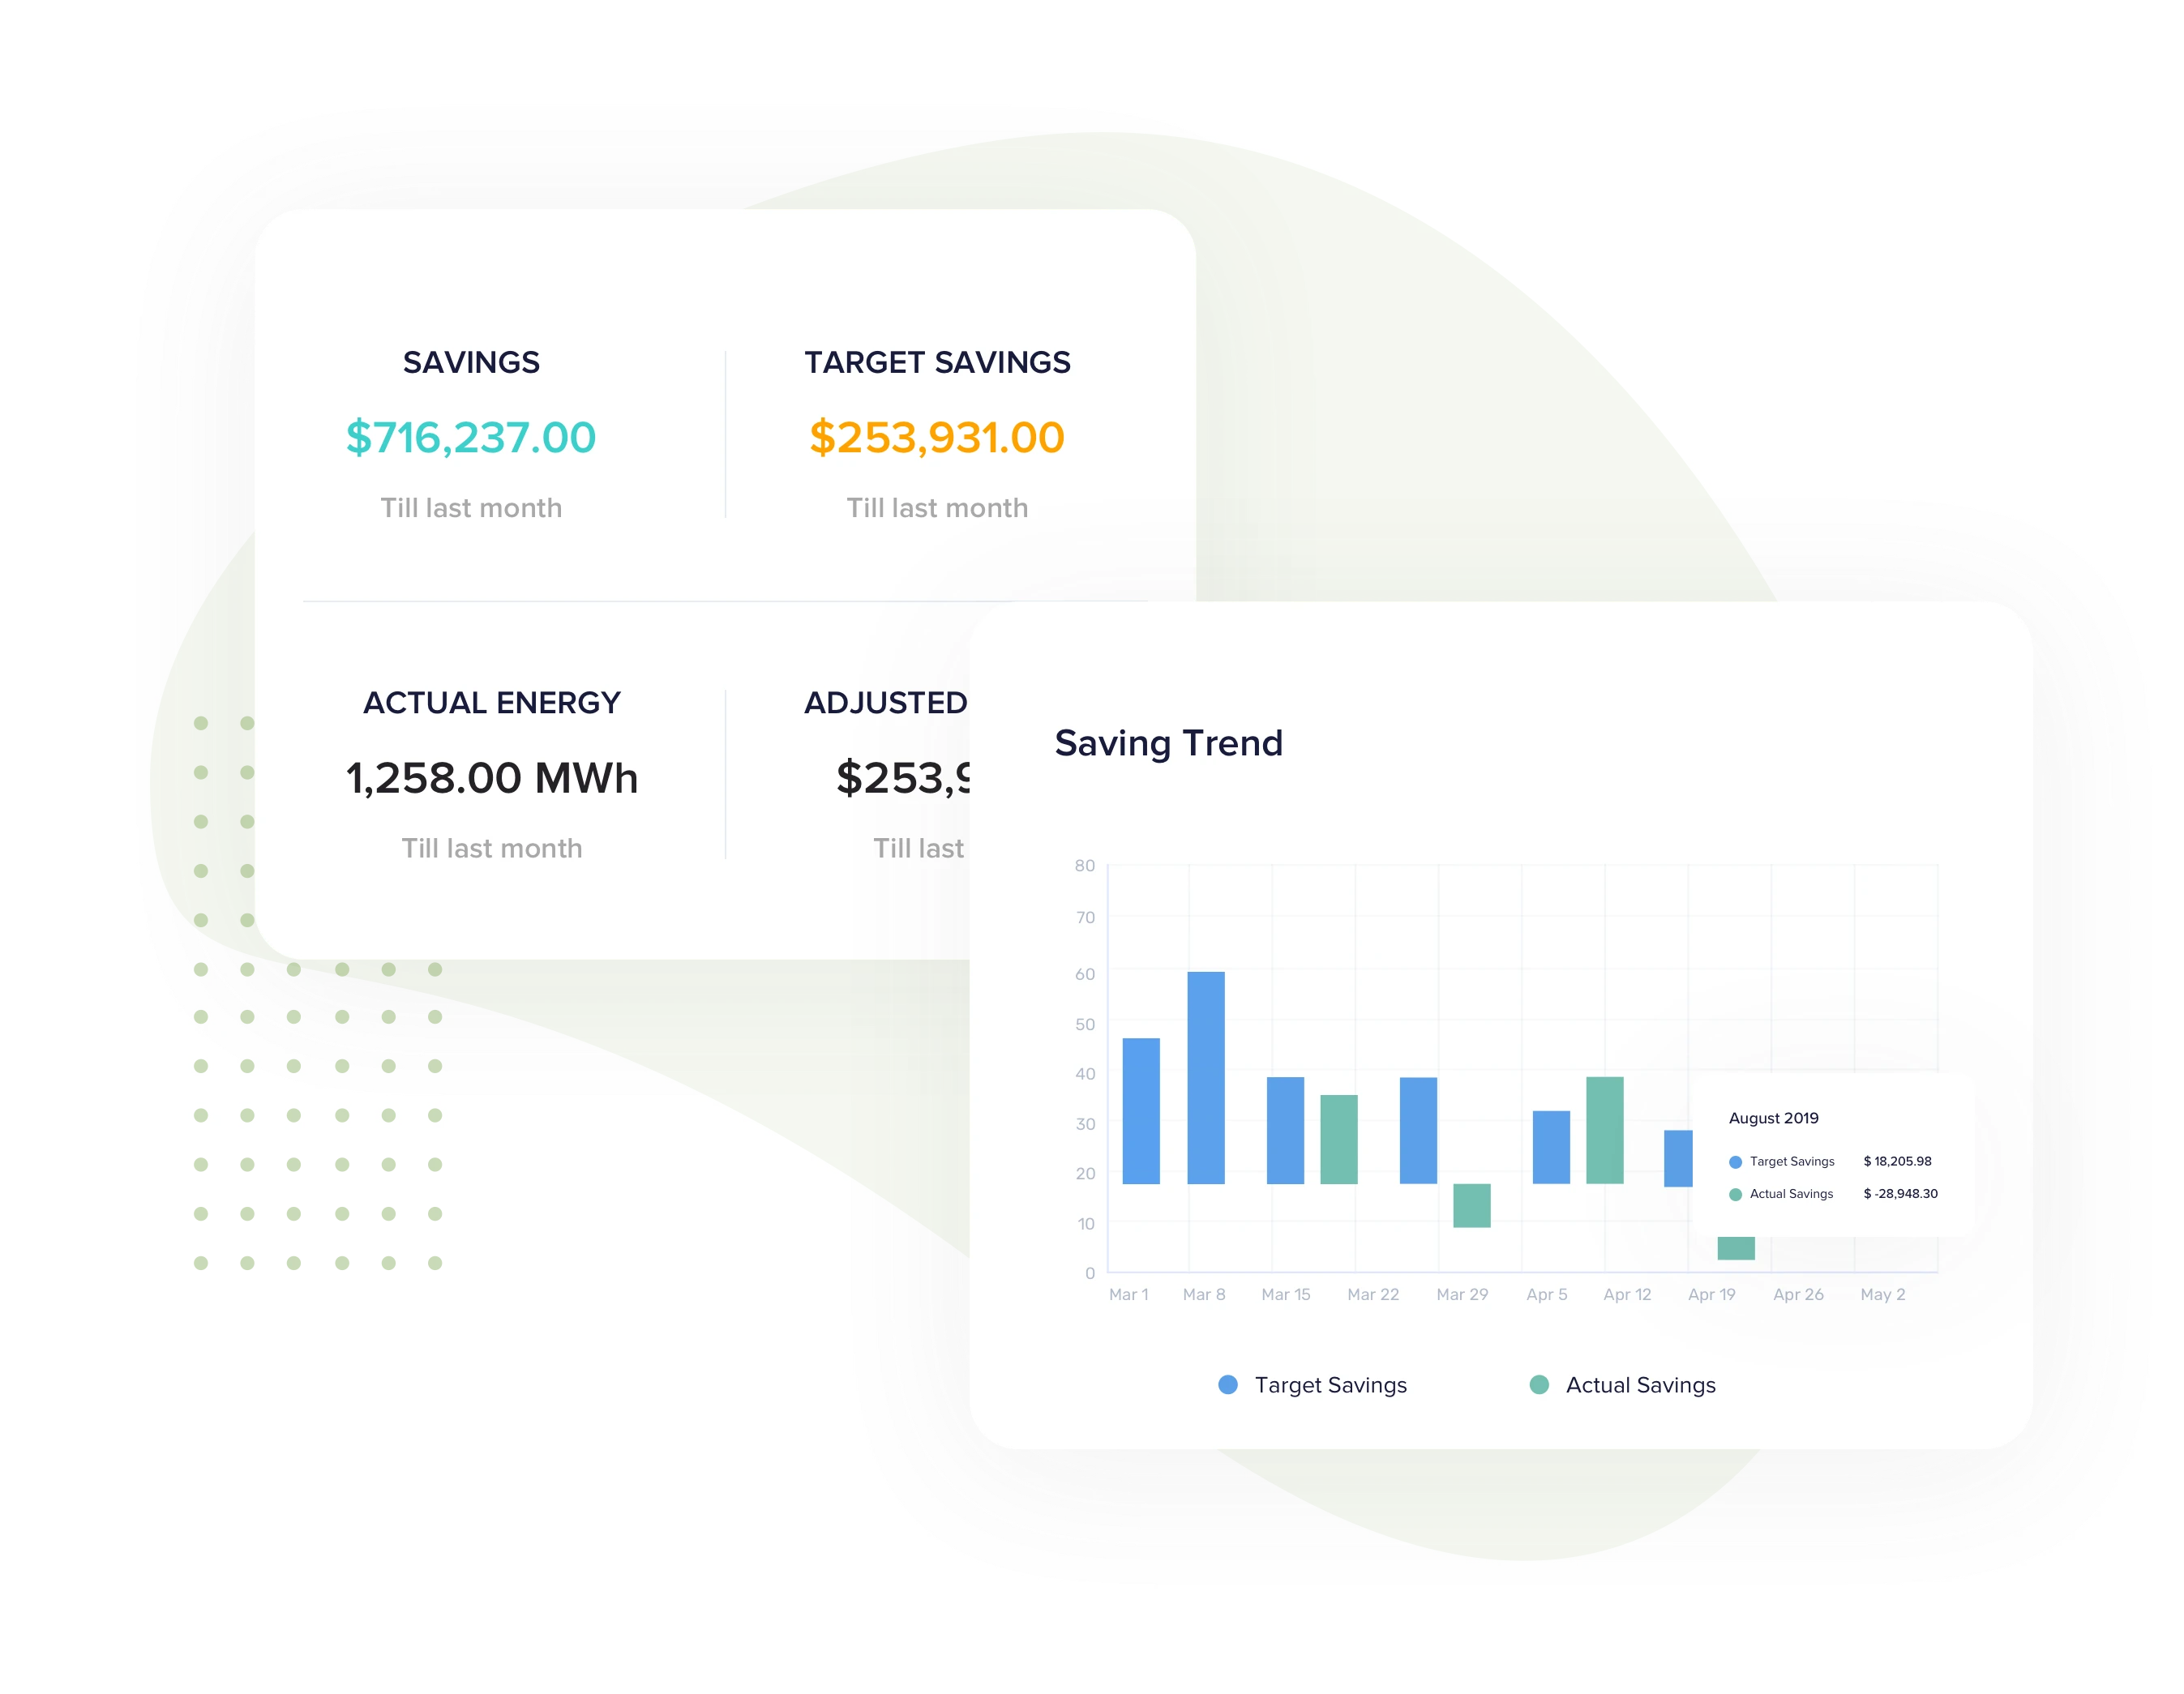
Take a pure-software approach to M&V to quell any savings uncertainties. Harness real-time data from connected assets for instant and highly-credible reports anytime. Easily incorporate complex adjustments or formulae for precise baseline conditions.
Uncover reliable findings for superior documenting of your project designs and budget. Bolster your ongoing peer-to-peer evaluation of facilities, or any ECM, with powerful Regression Analytics in-built.
EnPI-based energy tracker
Gauge effectiveness of
energy measures
With a default EnPI or lack of flexibility to select EnPIs that suit your enterprise’ needs, you hit a roadblock in expressing energy performance in adequately meaningful and easy-to-explain terms.
With Facilio, create unlimited EnPIs like tower energy per square ft, water usage intensity, etc., with any combination of data points. You can even link alarms for threshold deviations. Get a clear picture of progress across assets or buildings and show continual improvement in efficiency.
 Gauge effectiveness
 A colour-based approach to cracking data
Versatile Heatmaps
A colour-based approach to cracking data
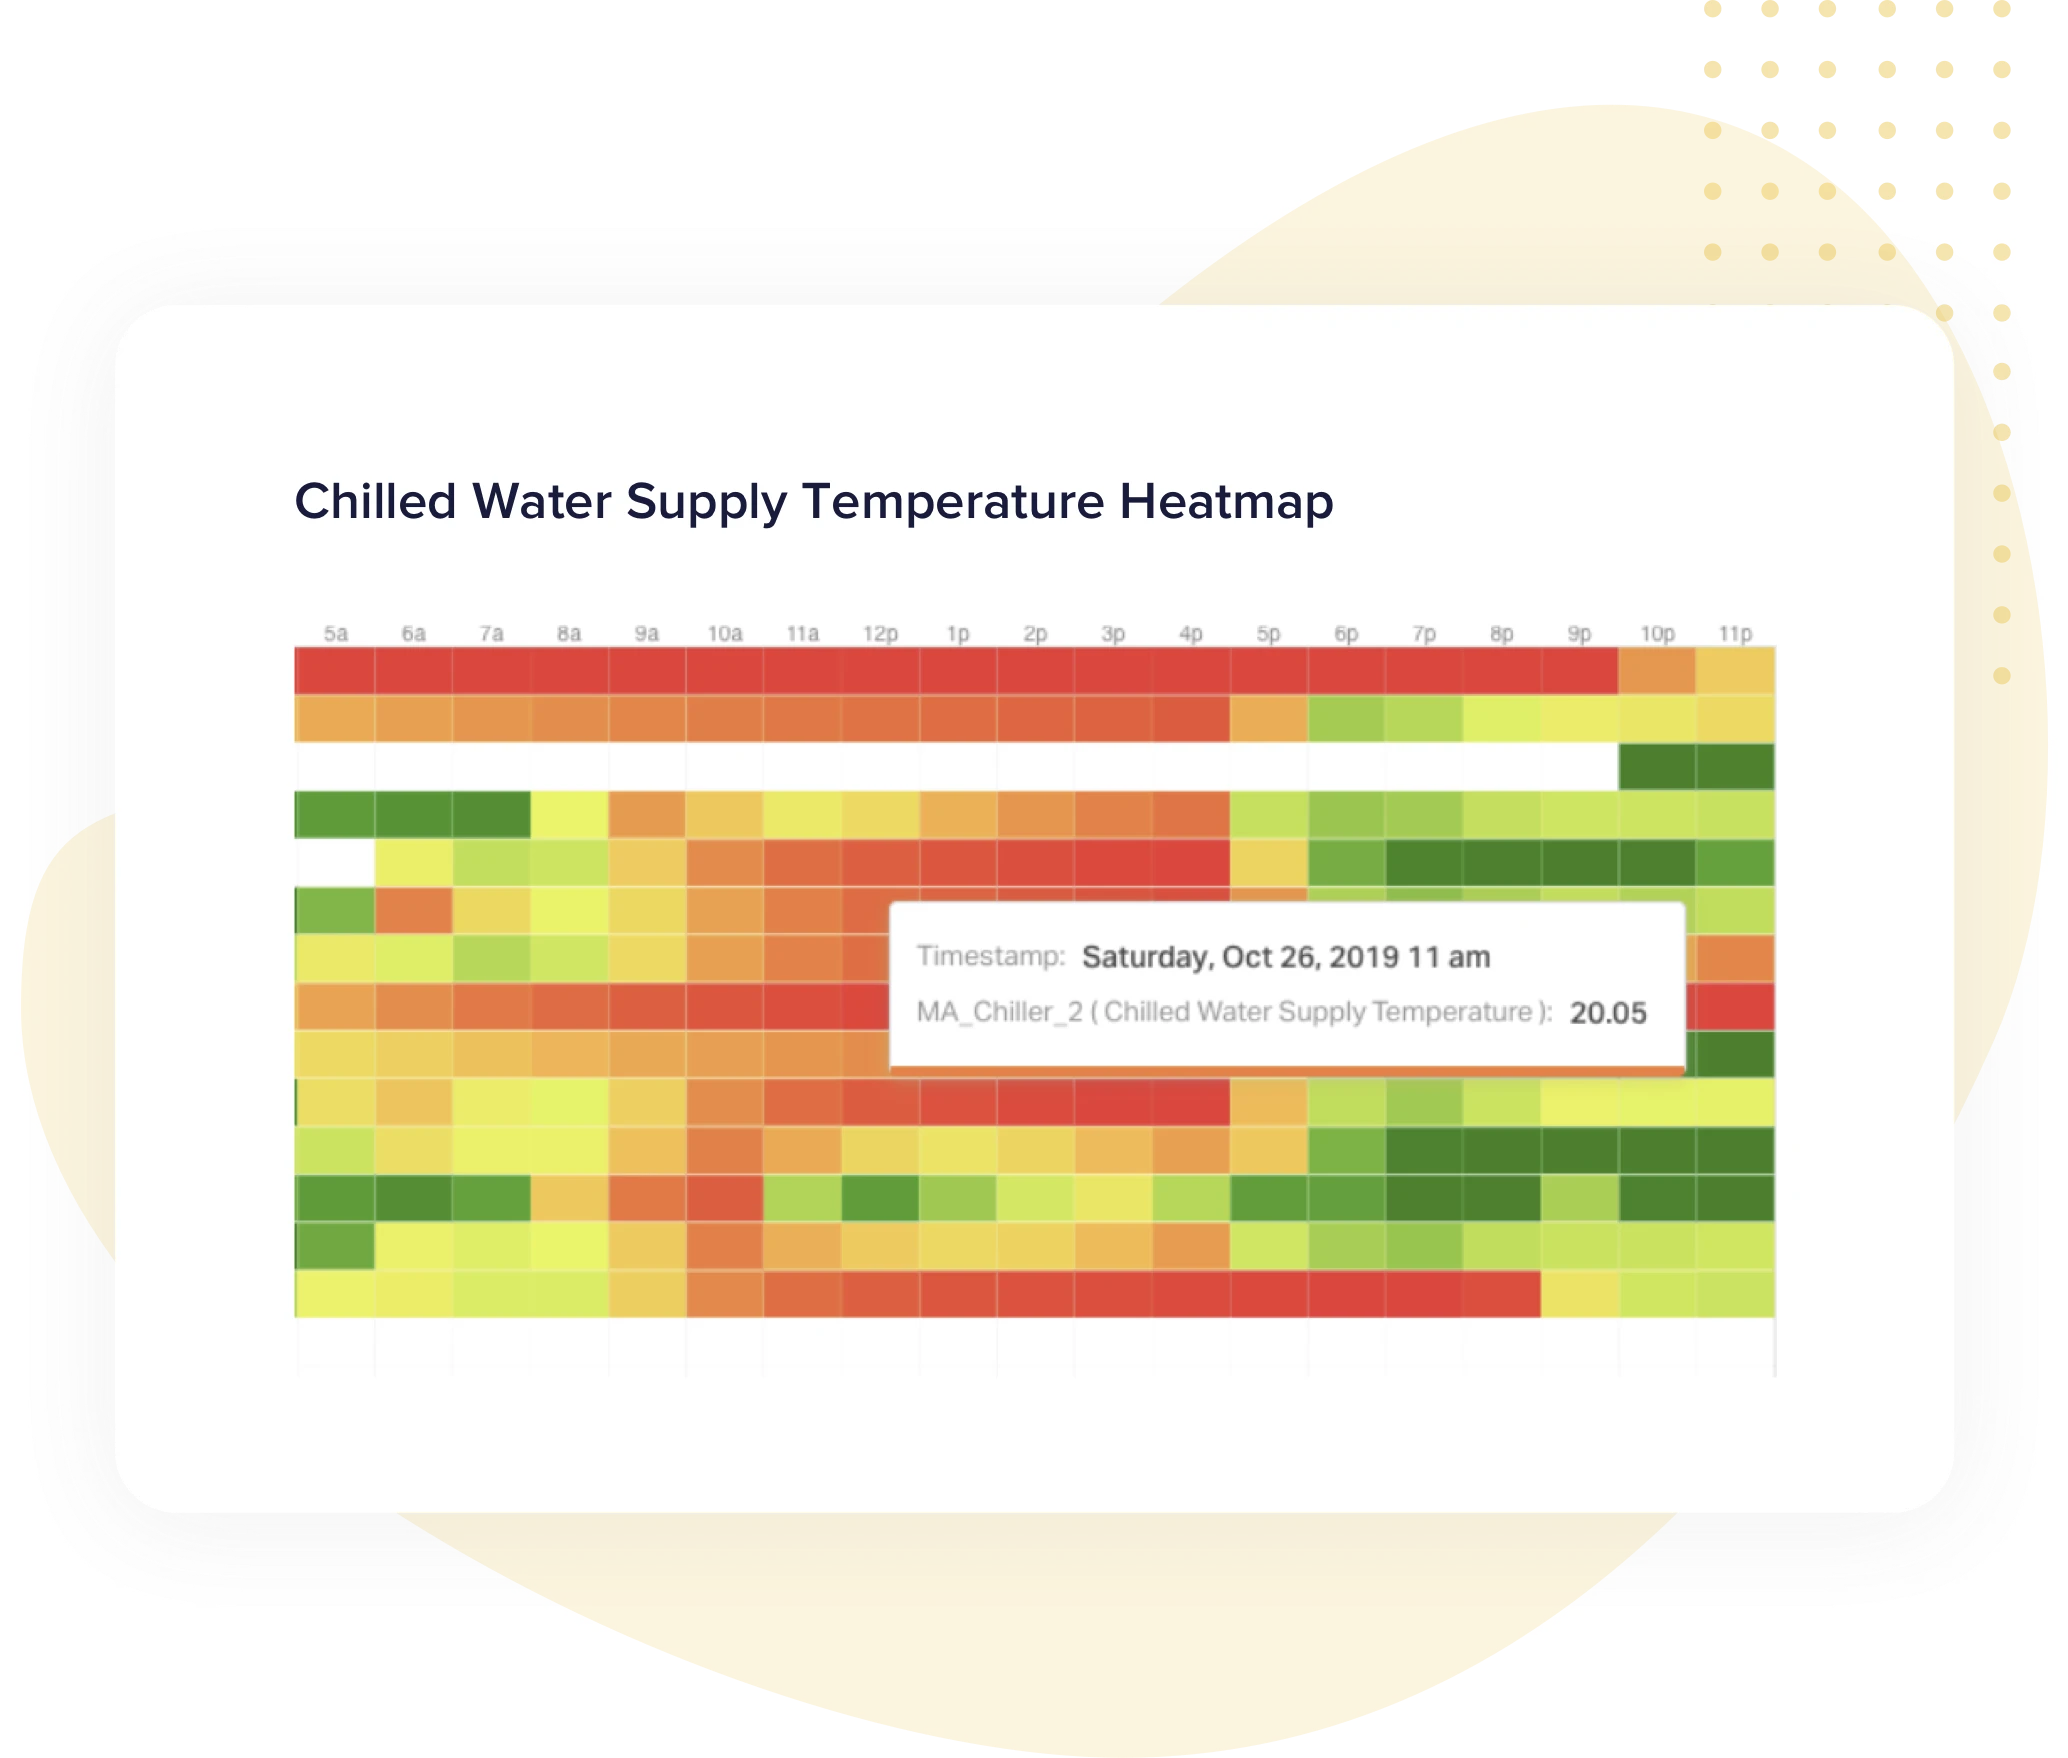
Pick any data point across the sea of assets or spaces to create visually-digestible heatmap charts. Play around with flexible timestamp preferences, and smart data point aggregation options to grasp in-depth your building behaviour.
Accomplish easy plotting of large and complex data and capture the trends in energy consumption. Grab an instant overview of key performance parameters and zoom in on areas that matter most.
FAULT DETECTION AND DIAGNOSTICS
Predictive Analysis,
Real Time Action
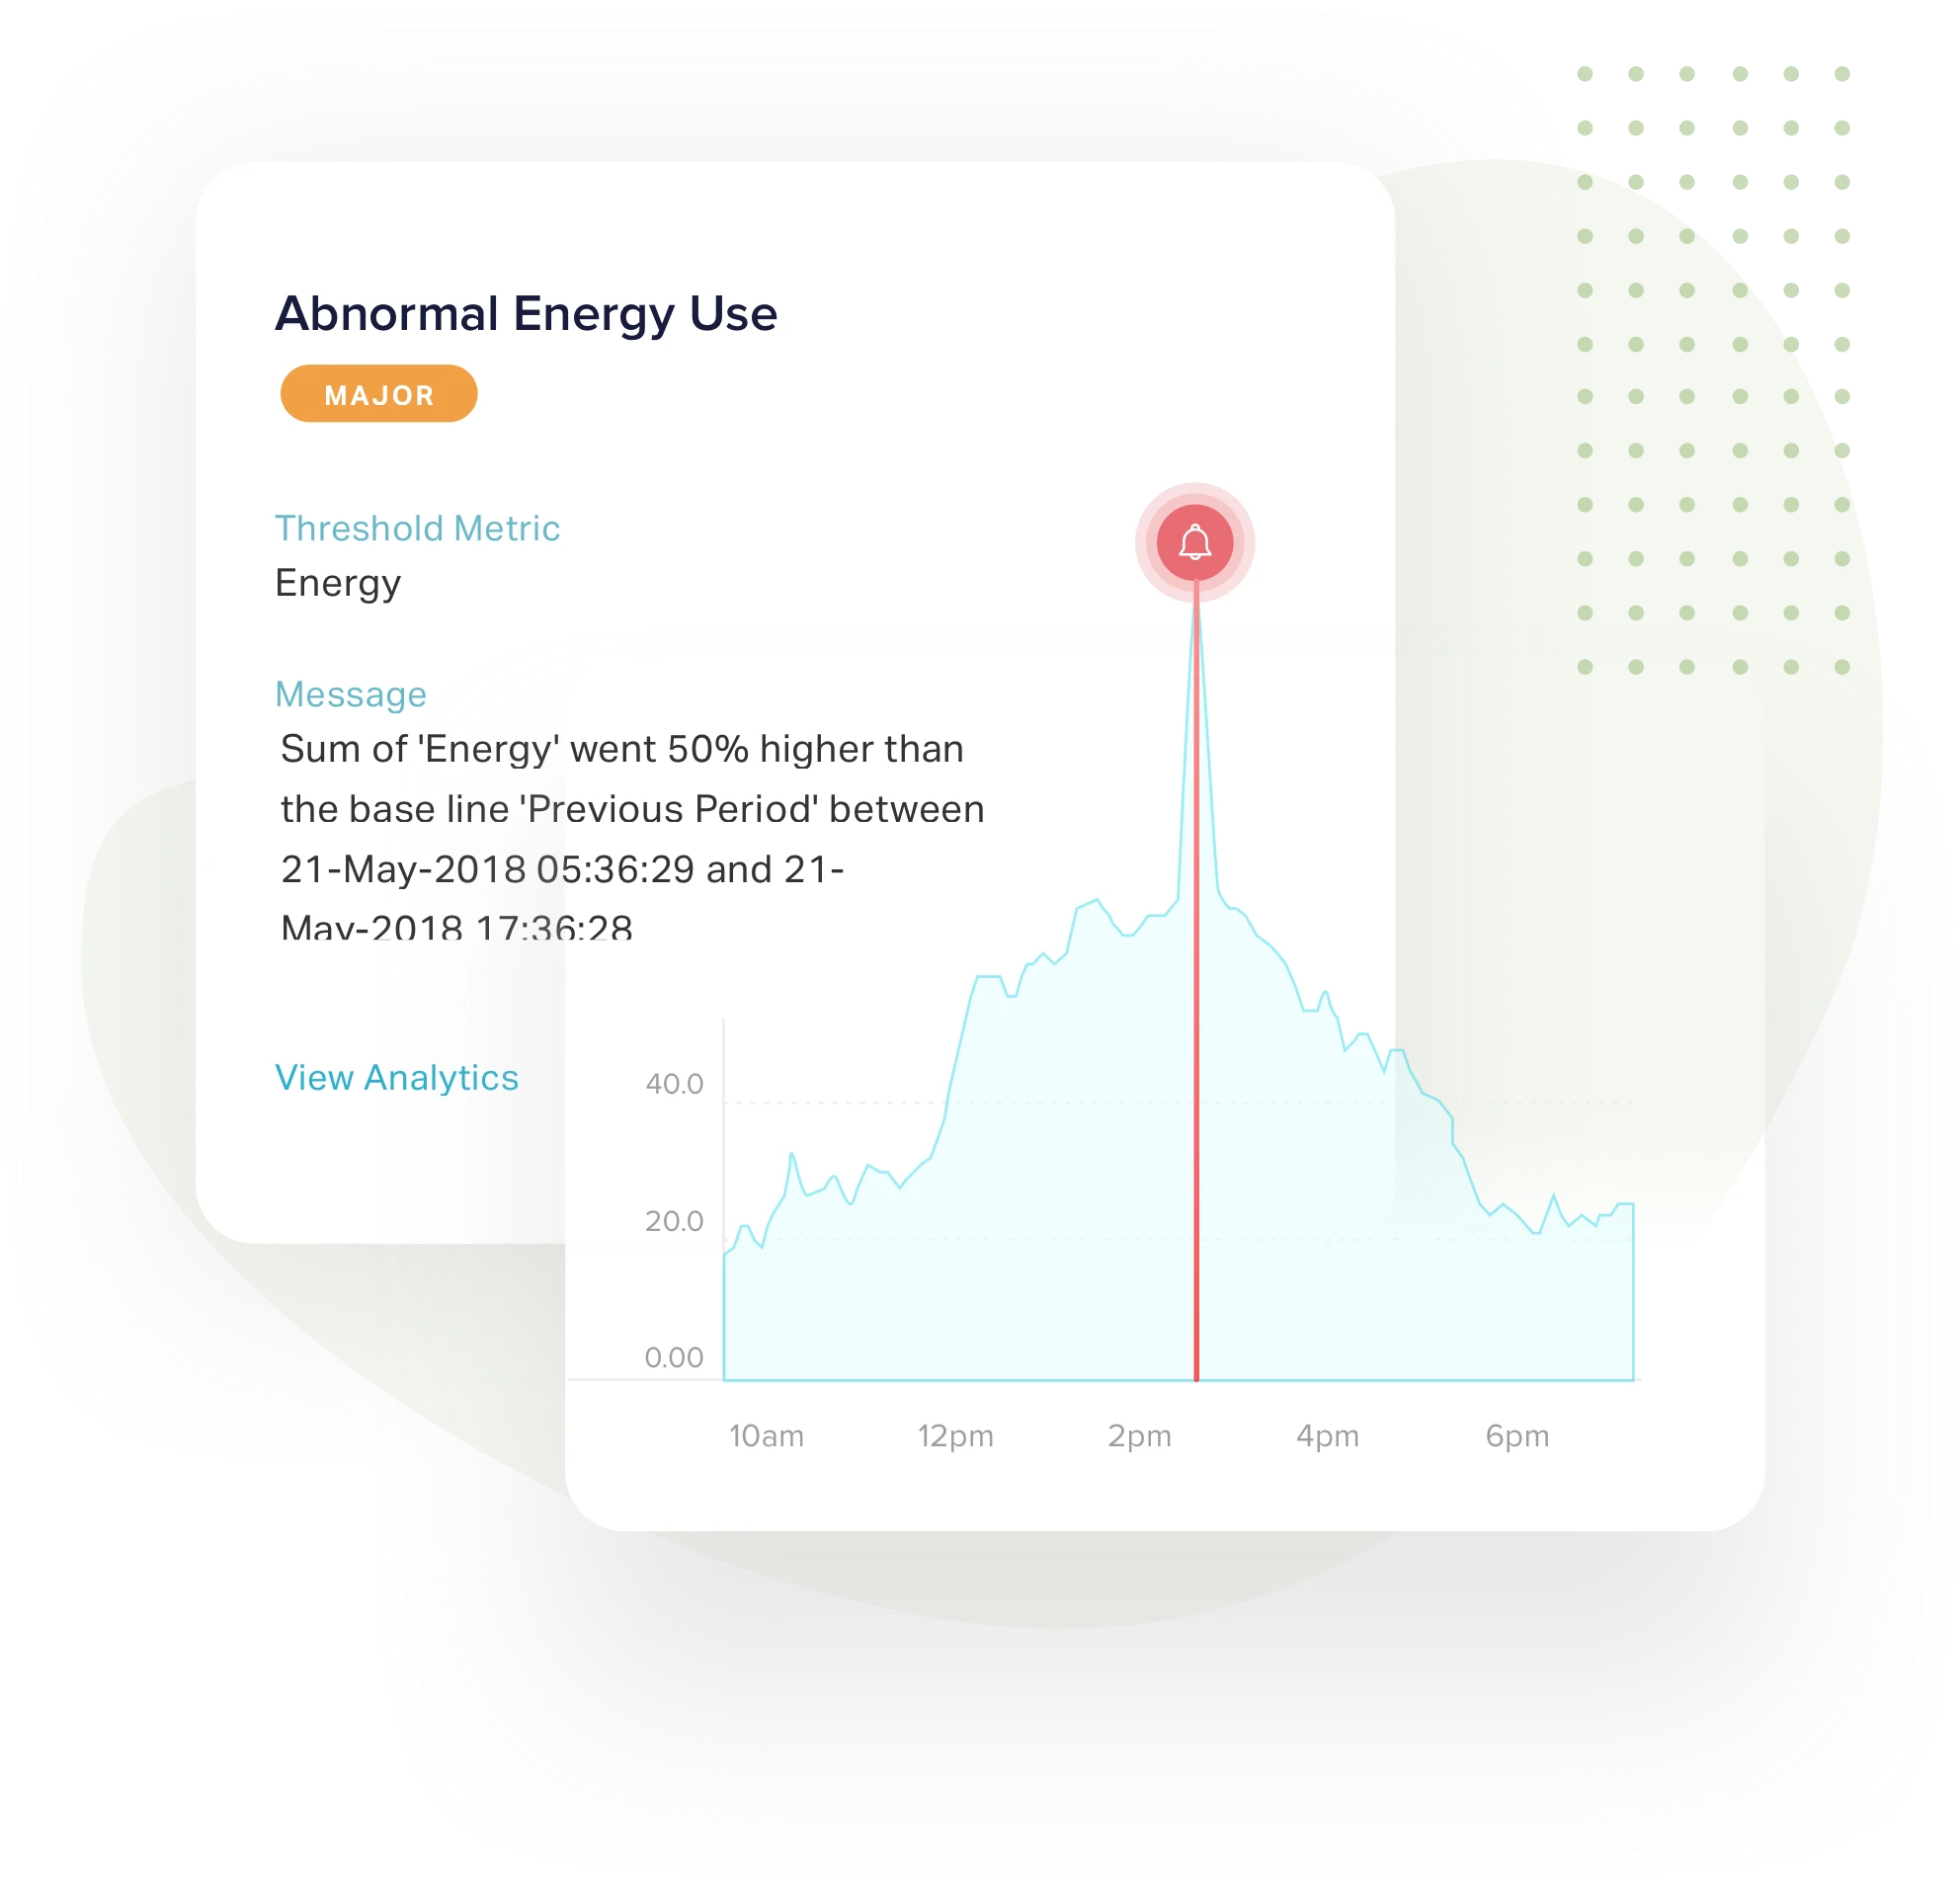
Are you spending hours poring over energy trend charts or pages of nuisance alarms - trying to figure out why you always get a specific alarm at 2.00AM?
Powered by Machine Learning models, Facilio’s FDD performs predictive analysis. It detects and diagnoses equipment failure by applying sophisticated rule-base (or simple configurable math expressions), in real-time and in the most easily digestible way - for example, an overridden setpoint in a VAV handler is now a no sweat at all.
Predictive Analysis, Real Time Action
Put every key performance within reach
BENCHMARKING AND REPORTS
Put every key performance within reach.
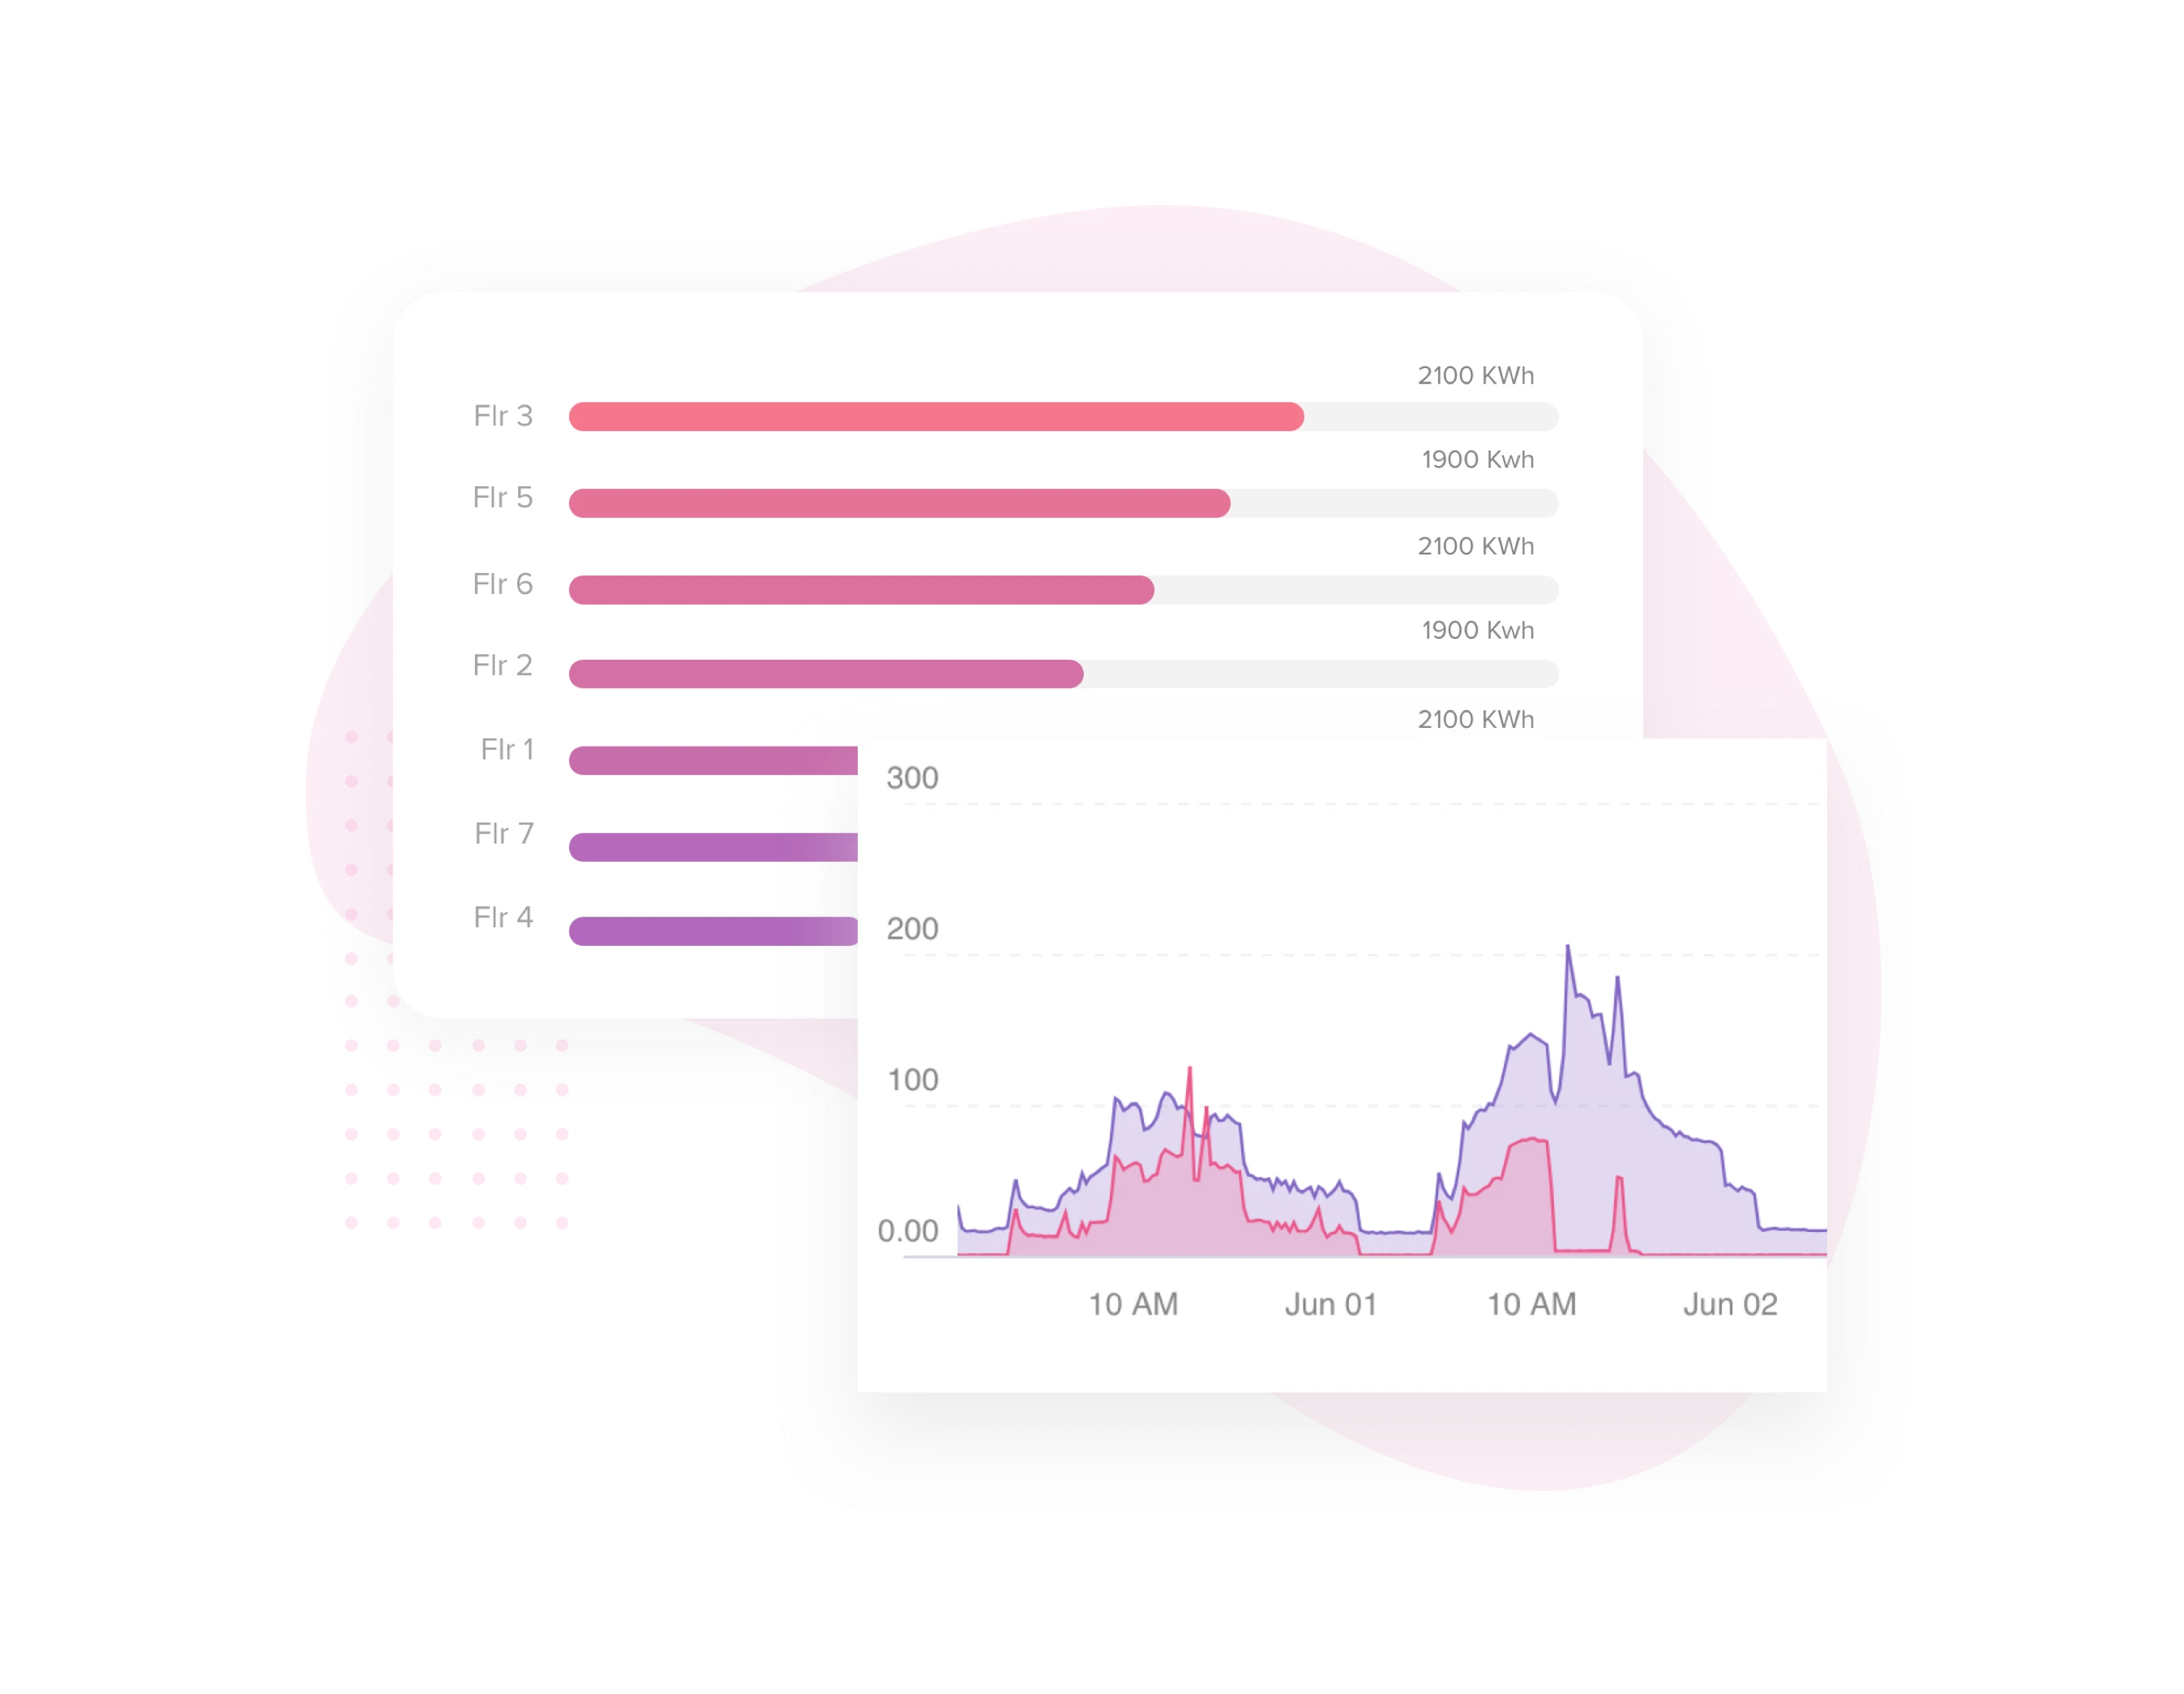
Instead of wondering how well your facility performs, get summarized key indexes whenever you need it. Know how your sites compare against similar property types, against global standards, within different reference systems, the current status on everything that’s needed for compliance, and what you need for upcoming audits.
Facilio lets you easily create and set baselines, compare variance, dig into detailed chiller performance, and rank sites on granular KPIs
SMART WORKFLOW
Tie operations together
- anomaly to resolution
In the past, analytics meant painfully harvesting data from slow tools and leaving it to stay inactive in multiple silos. Today, teams can take action faster with enriched insights.
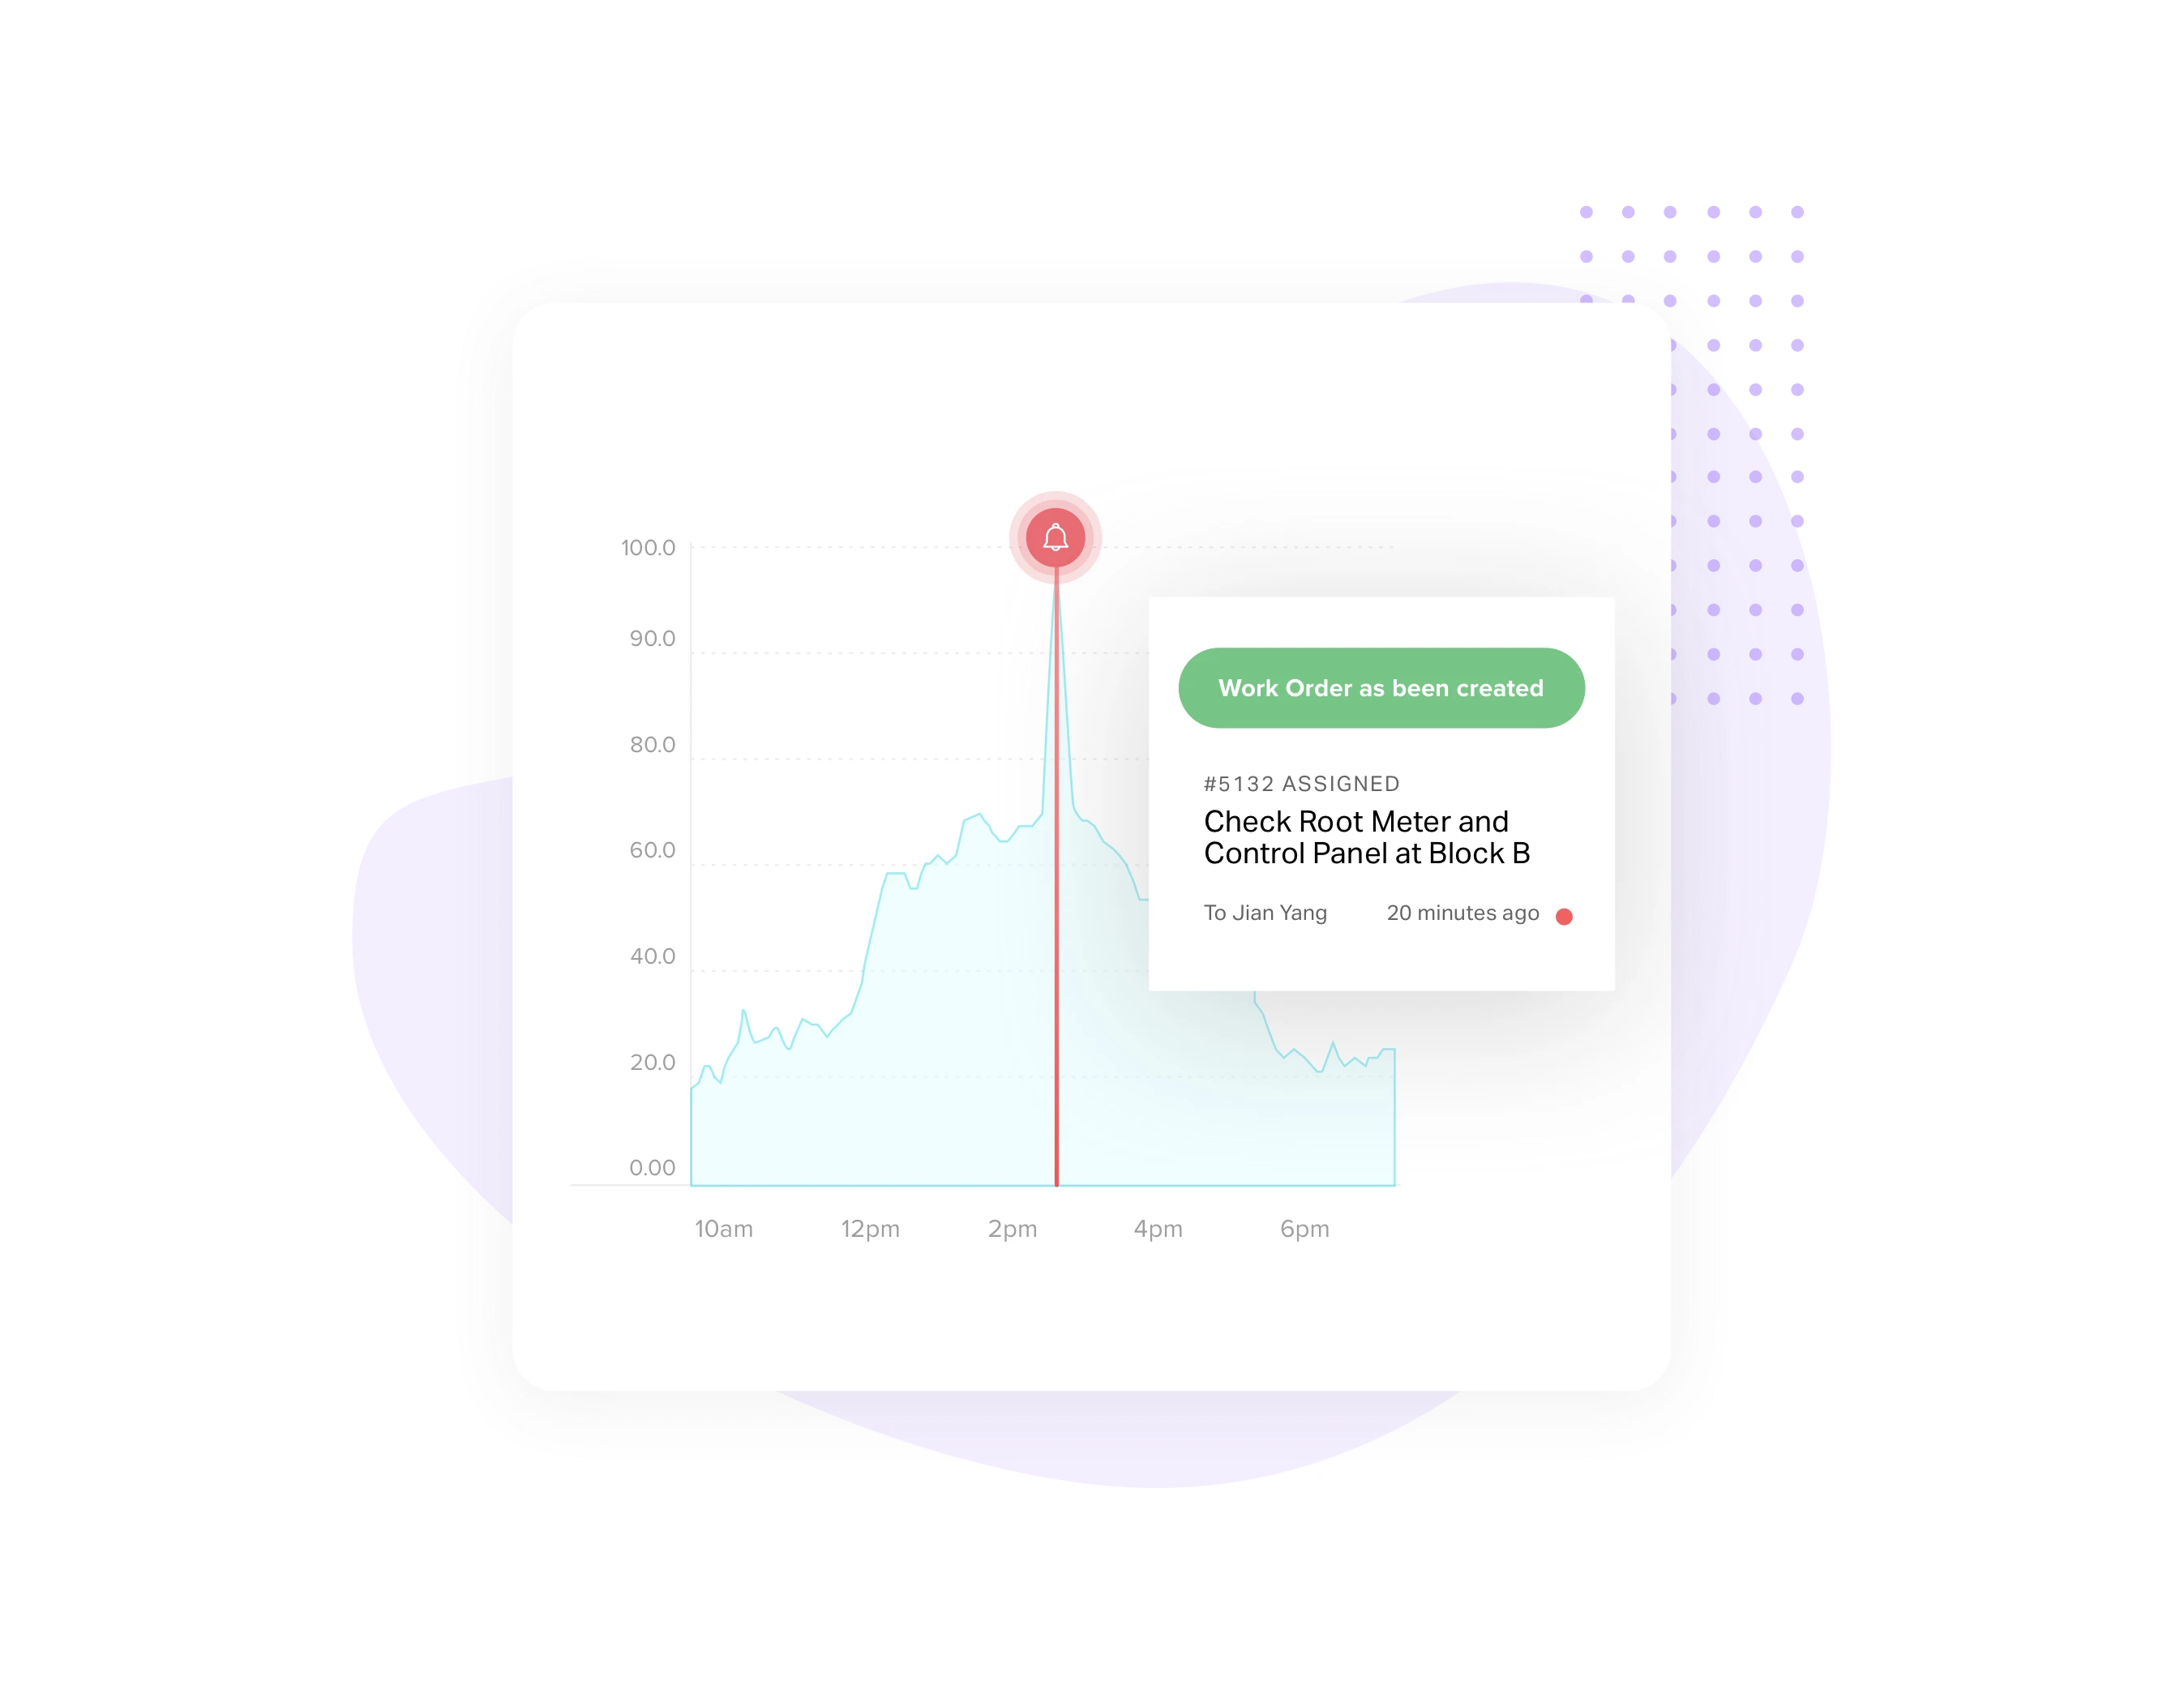
Facilio ingests performance anomalies from asset and energy data and automatically triggers work orders to teams immediately. Optimize for faster resolution and boost your building performance in real-time.
Tie operations together anomaly to resolution
More metering, no added cost
VIRTUAL METERING
More metering, no added cost
We’ve heard, time and again, that you cannot manage what you cannot measure. But the cost to purchase and install physical meters for a building using hundreds of VAVs, could be far more than the savings you expect to recover.
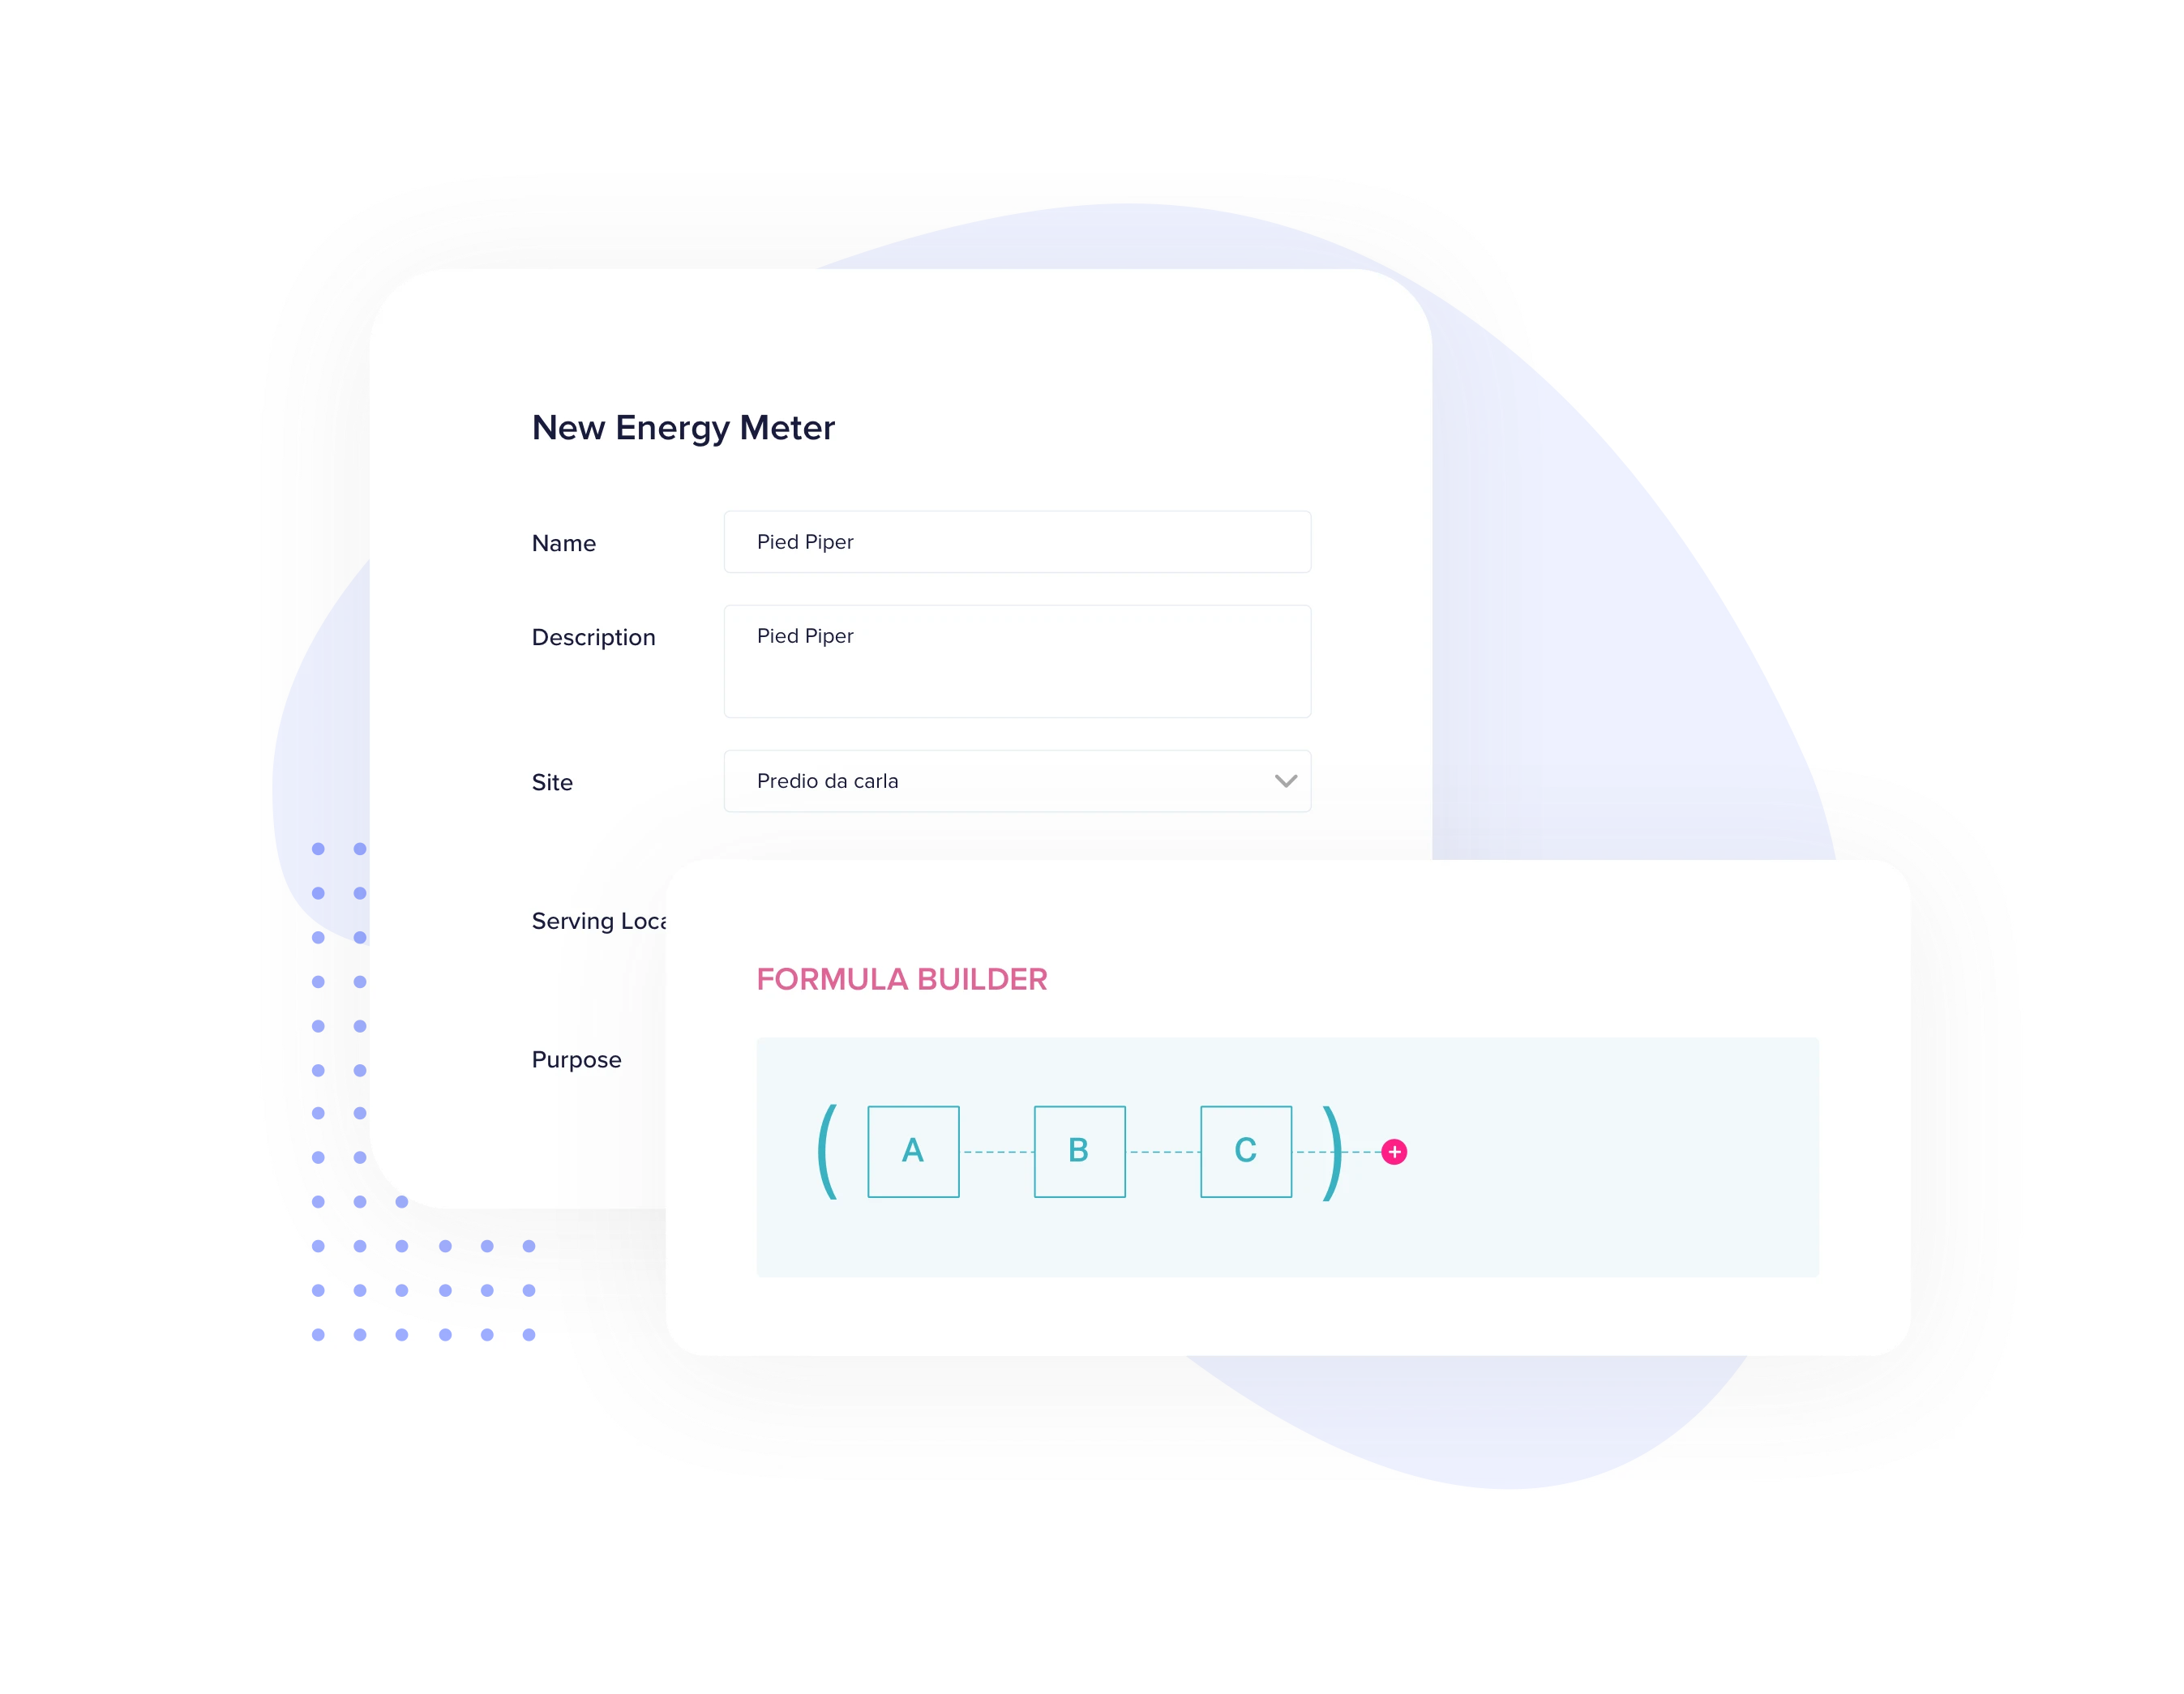
With Facilio, you can easily virtualize meters on the cloud. It lets you combine and divide meters in various proportions to create target VMs, giving you the benefit of metering without the additional expense that traditional meters bring.
TENANT BILLING
Create a premium
experience for tenants
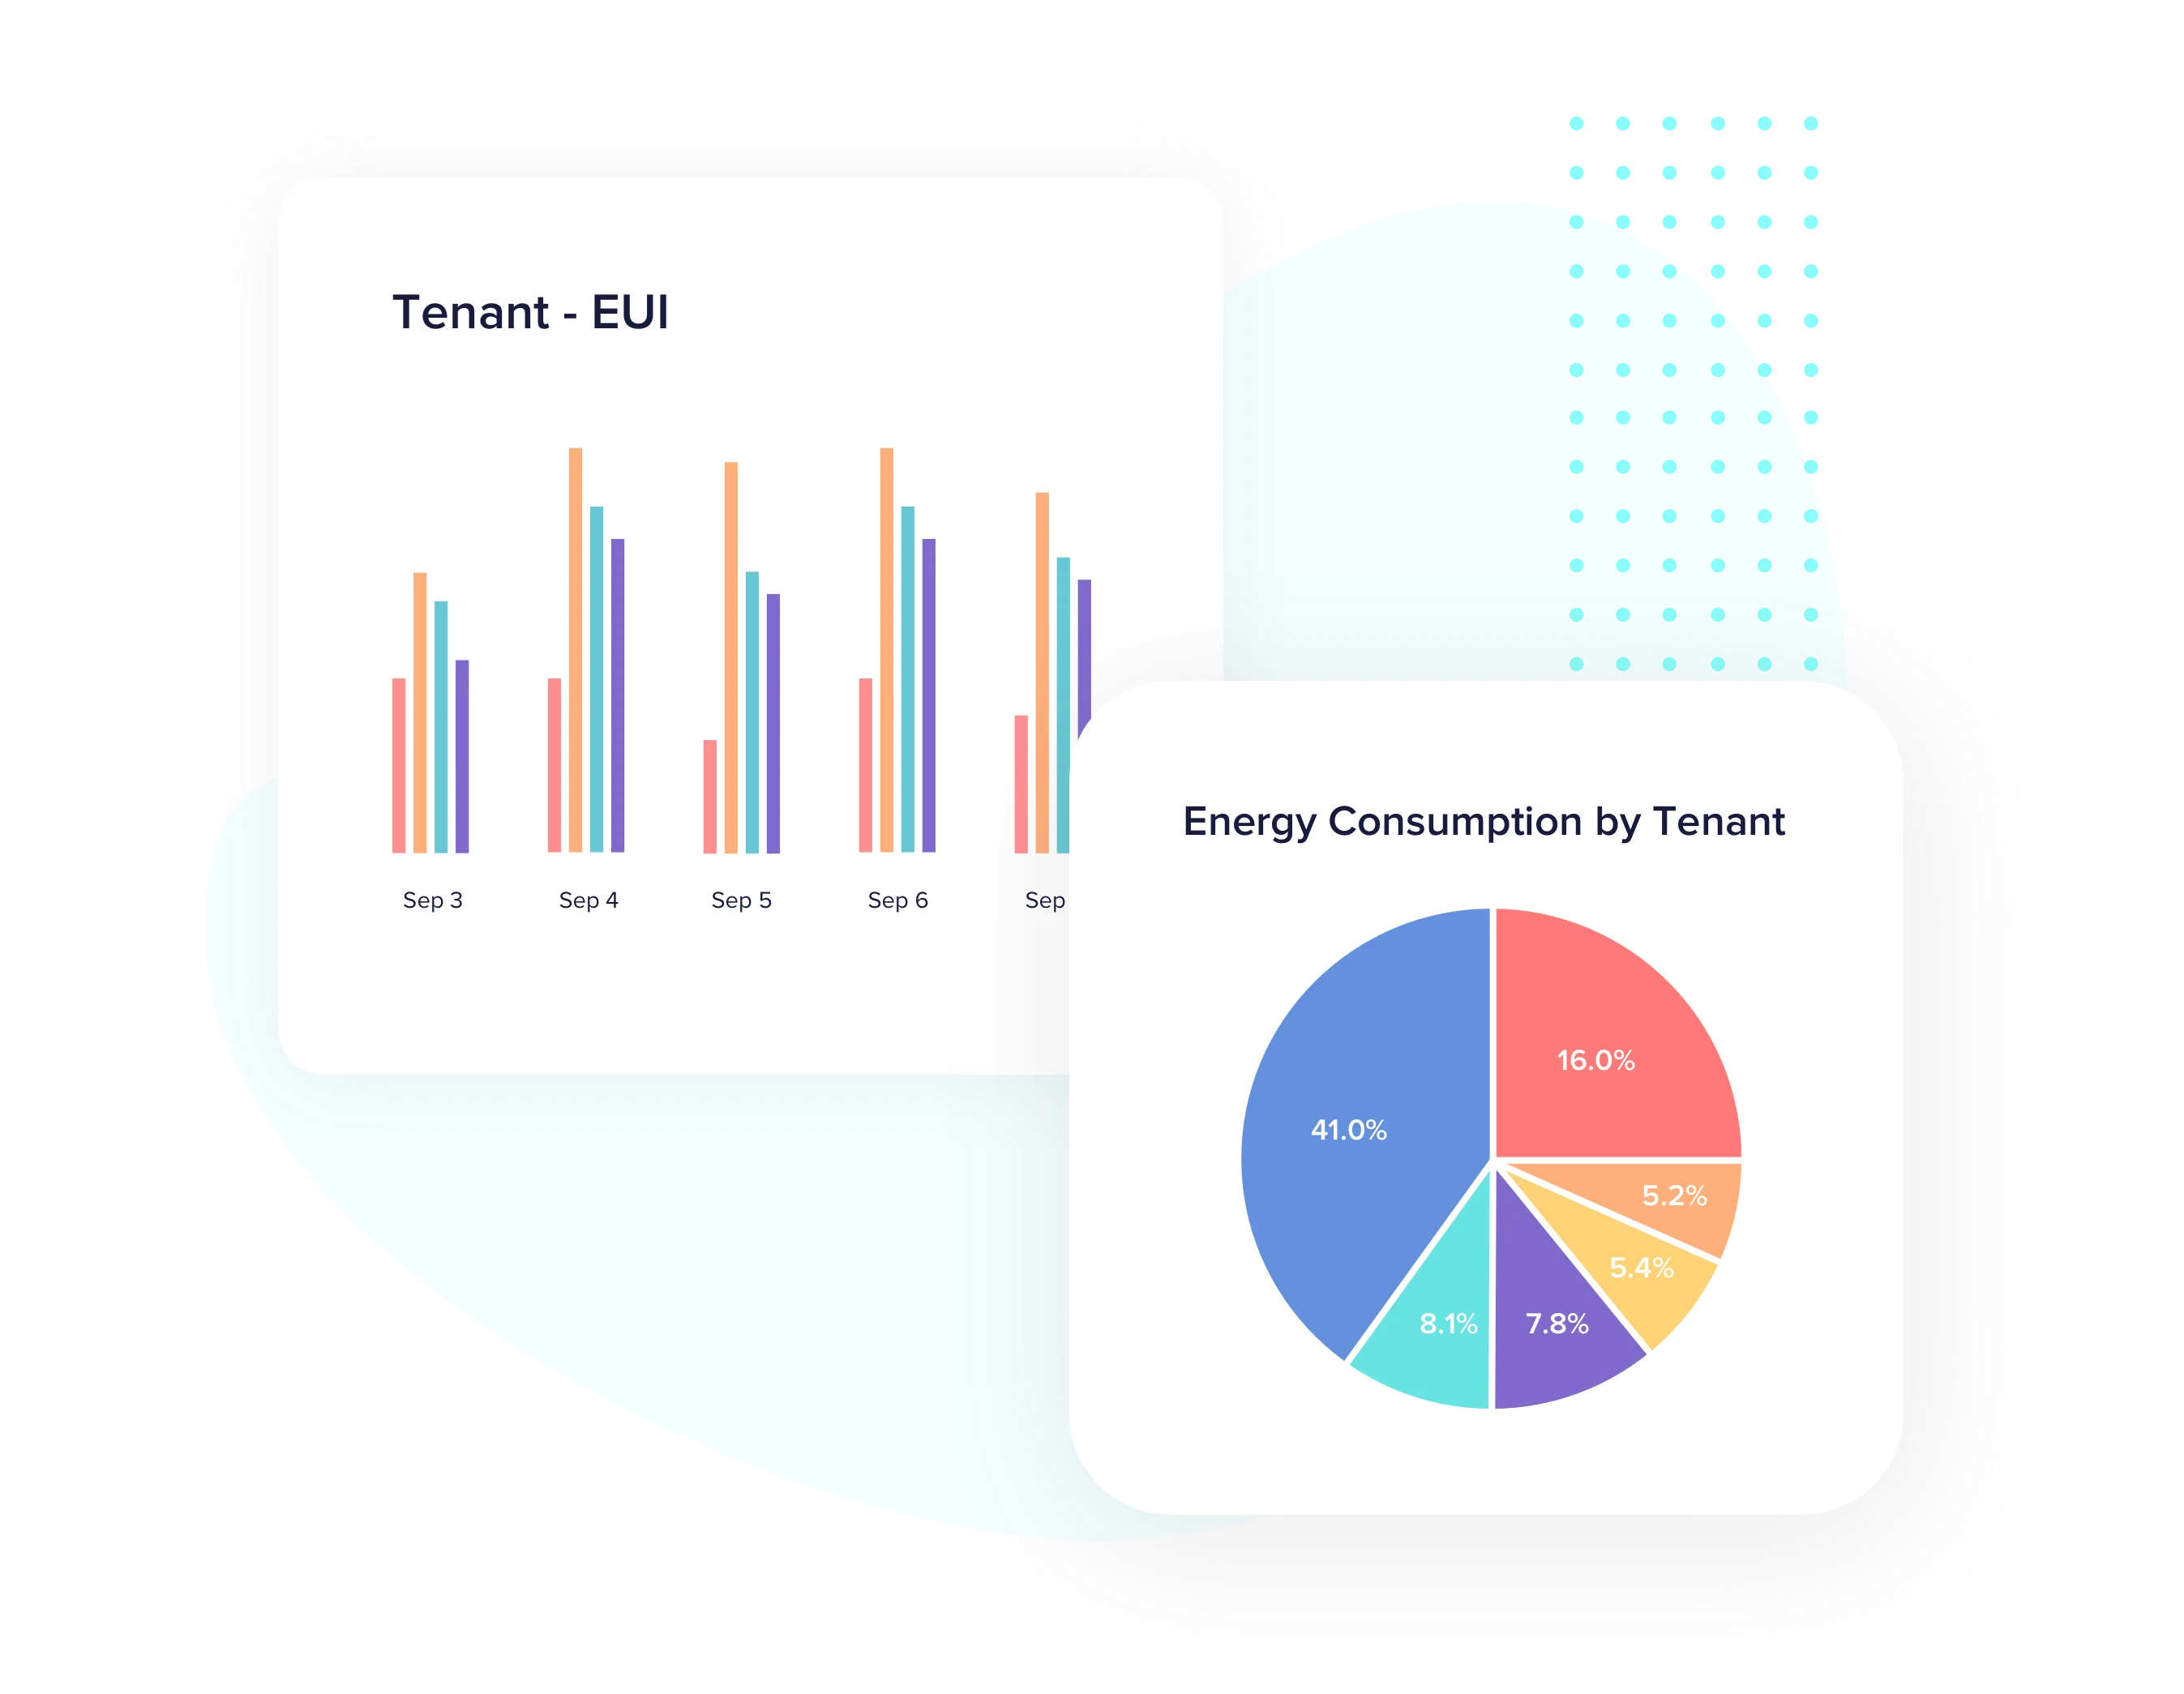
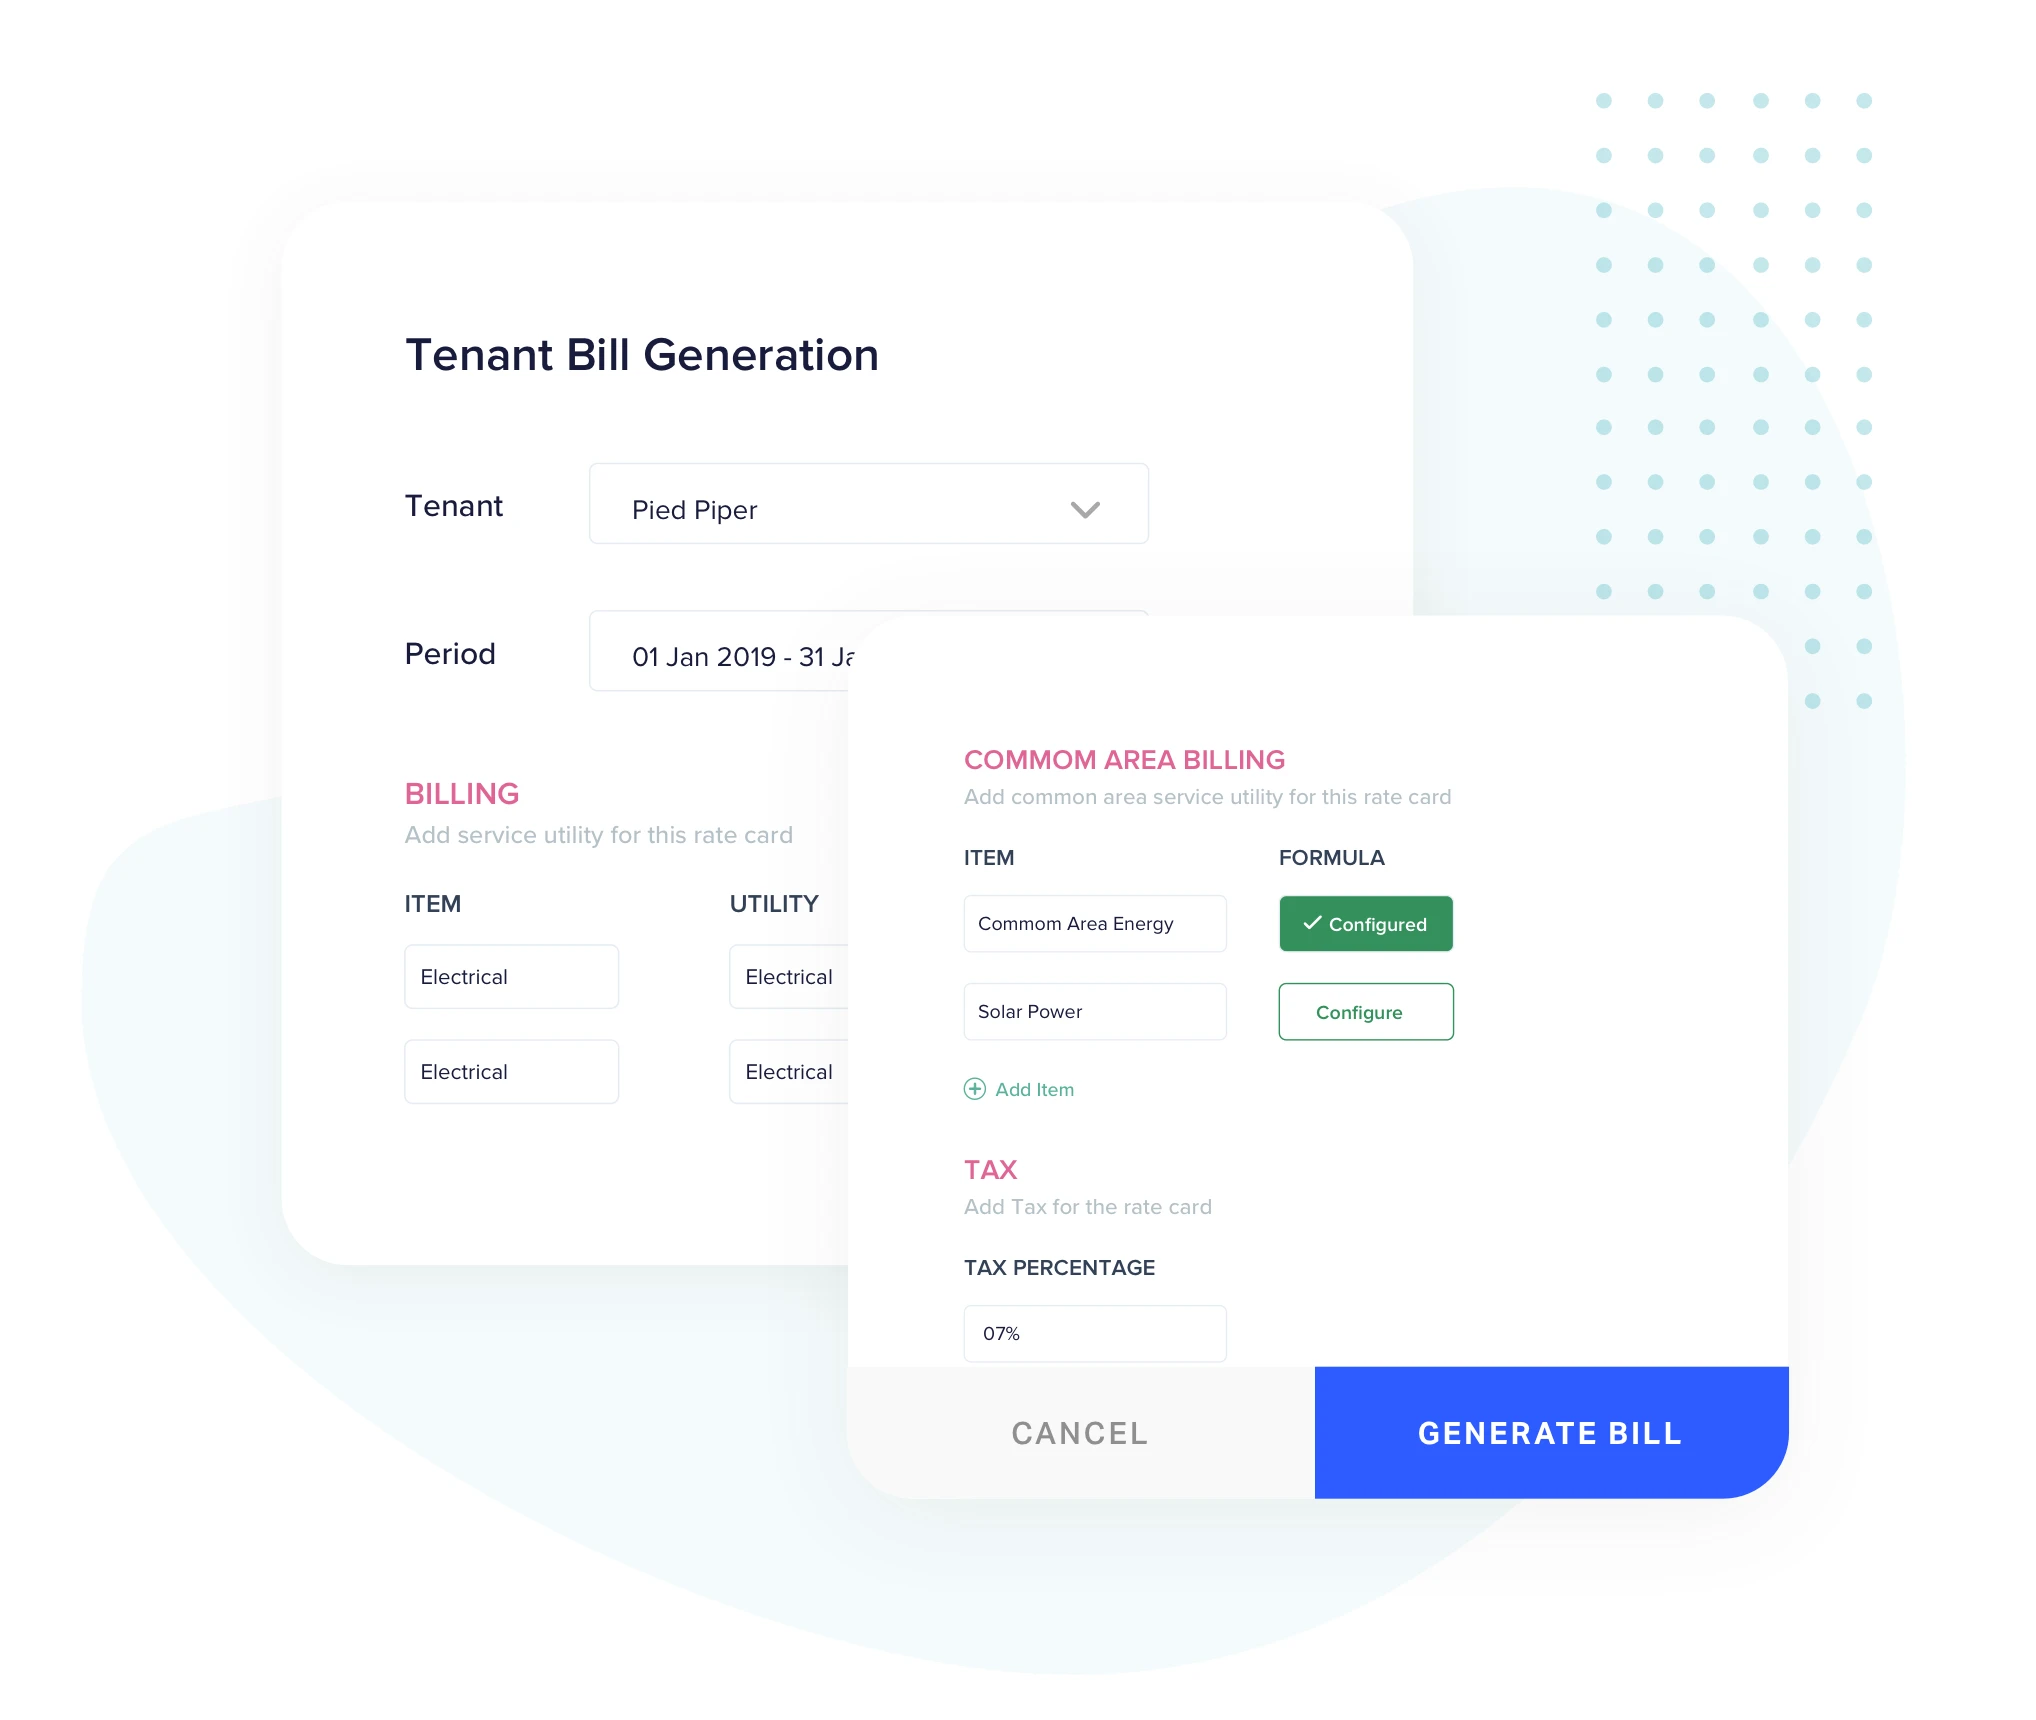
Noting down meter readings on paper or analyzing BMS data on a spreadsheet typically adds an average delay of 35-40 days between billing period and when costs get recovered. But not with Facilio.
Facilio automates meter readings with mobile apps or directly via BMS interfacing. Avoid discrepancies with tenants, automatically generate custom invoices, and easily keep track of recovery across portfolio.
Create a premium experience for tenants

The complete toolkit to achieve sustainability

Facilio is built to make life easier for commercial real estate professionals
Central Command

Empower facilities with a central
command center using Facilio to
manage sustainability across
portfolio.

Full Lifecycle

Cover full operational life-cycle
from equipment to energy
performance, identify deviations,
resolve faster and
avoid drifts.

Real-time IoT Data

With Facilio’s unique software driver,
easily integrate with existing BMSs
to collect and normalize multiple
data streams.

Mobile Notifications

Keep up with anomalies, track
metrics faster, and receive real-time
notifications on your mobile
with Facilio’s native app.

Baseline Operations

See today vs yesterday, this month
vs last month, or any specific
duration, and quickly identify
opportunities to correct off-baseline
performance.

Asset Vendor Accountability

Analyze reports to identify high and
low performing assets, track assets
with frequent complaints, those that
regularly run below capacity.

Retrofit Evaluations

Validate savings for a project,
position your facilities for future
transactions, or determine which
projects should be conducted to
improve rents.

Shareable Dashboards

Have a better ability to share
specific dashboards with relevant
managers, create a centralized
location to update or add notes on
upcoming or key activities.

Custom Reports

In addition to standard available
reports, easily build or schedule
reports based on any metric
(time period or data type) that is of
focus to you.

Facilio's connected buildings approach has helped us upgrade the quality of service for our customers, using the same resources and assets that were at our disposal earlier. We increased our workforce productivity by 13% within 6 months of digitizing operations using Facilio.

customer
Sangeetha B
GM, Al Fajer.

Facilio has changed the way we manage buildings. It’s time-consuming to deliver CRE solutions, especially to large projects (that of a leading airline company) - so having a single tool to track, manage, and control asset performance in real-time is incredible. We now have a central place to manage distributed properties more efficiently.

customer
Bhadra Prasad
Operations Manager, Middle East

Facilio is a very powerful tool. We were able to quickly connect portfolio systems, set up a command center, and scale O&M services across properties effectively.

customer
Paulo D
CEO

With more than 35 distributed workspace infrastructure, we were looking at ways to efficiently optimize operations and maintenance activities across our portfolio. Facilio gave us a single centralized platform to organize mobile maintenance schedules, compliance activities, and manage vendor workflows, across multiple locations.

customer
Deepak Dhadich
Senior VP