- To digitize the utility records and automate energy analysis across the campus
- To improve the visibility into building performance and consumption patterns by centralizing the additional HVAC/BMS Systems
Campus's Vision:
To increase sustainability goals and uncover savings
opportunities by lowering the utility costs
The campus is committed to steadily improving its sustainability
targets, digitizing its records, and, most importantly, reducing
energy consumption and achieving operational efficiency. The
campus has chosen Facilio's connected buildings solution to
achieve this goal.
Challenges Faced by the Campus:
Due to the lack of a centralized asset management system, the campus had to face the following challenges:
- Inaccessibility to real-time insights: The lack of real-time insights into energy consumption prevented the campus from optimizing building performance and making informed decisions.
- Untapped savings potential: Inefficient energy management and lack of comprehensive analytics prevented the campus from identifying potential cost-saving opportunities within its buildings.
- Poor occupant comfort: Inadequate temperature control and air quality negatively impacted the occupant's comfort, affecting their productivity and well-being.
- High utility bills: Excessive energy consumption and lack of optimization strategies contribute to high utility bills, straining the campus's financial resources. The inability of the O&M teams to figure out the consumption patterns led to the campus incurring high utility bills.
Facilio's Solution:
Empowering campuses with IoT-driven energy management for cost-effective operations
Facilio's end-to-end digital transformation solution enables the renowned university to streamline its building management processes and optimize its overall campus building operations. By leveraging the power of IoT, Facilio acts as a one-stop shop for the campus to optimize its energy programs across its entire portfolio of buildings, enabling them to achieve operational efficiency, sustainability, and enhanced occupant experience.
The Campus has adopted two levels of Facilio's decarbonization journey
Level 1
- Utility Bill Analysis
Level 2
- Energy Analytics and Dashboards
- Fault Detection and Diagnostics
Here are the solution highlights:
Maximized savings potential with Utility Bill Analysis
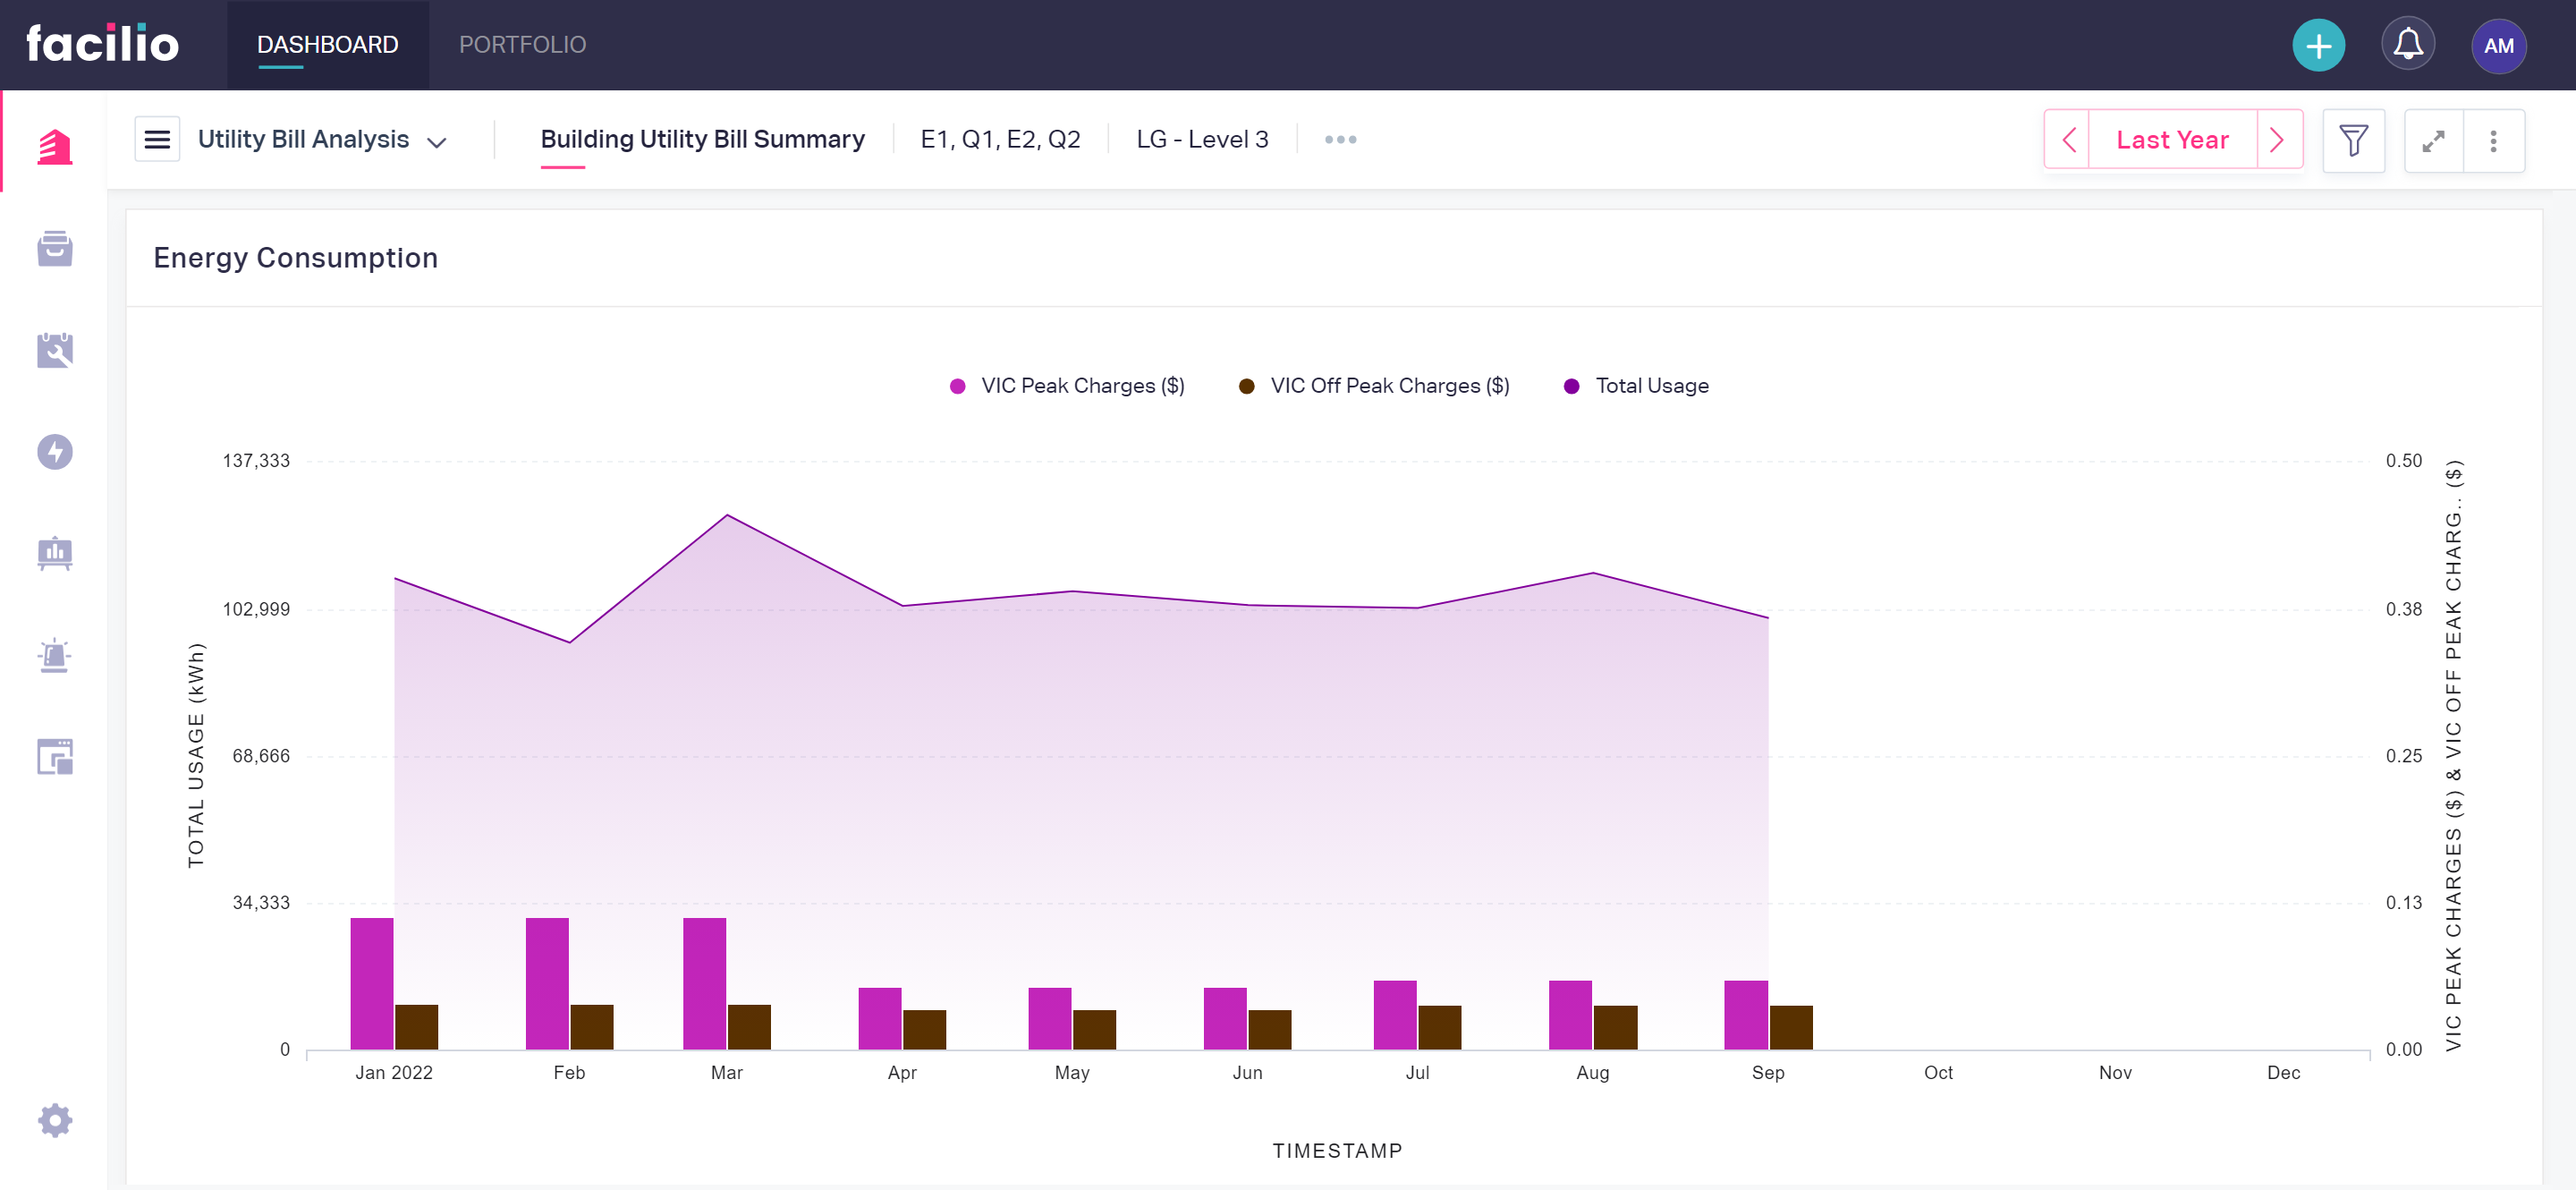
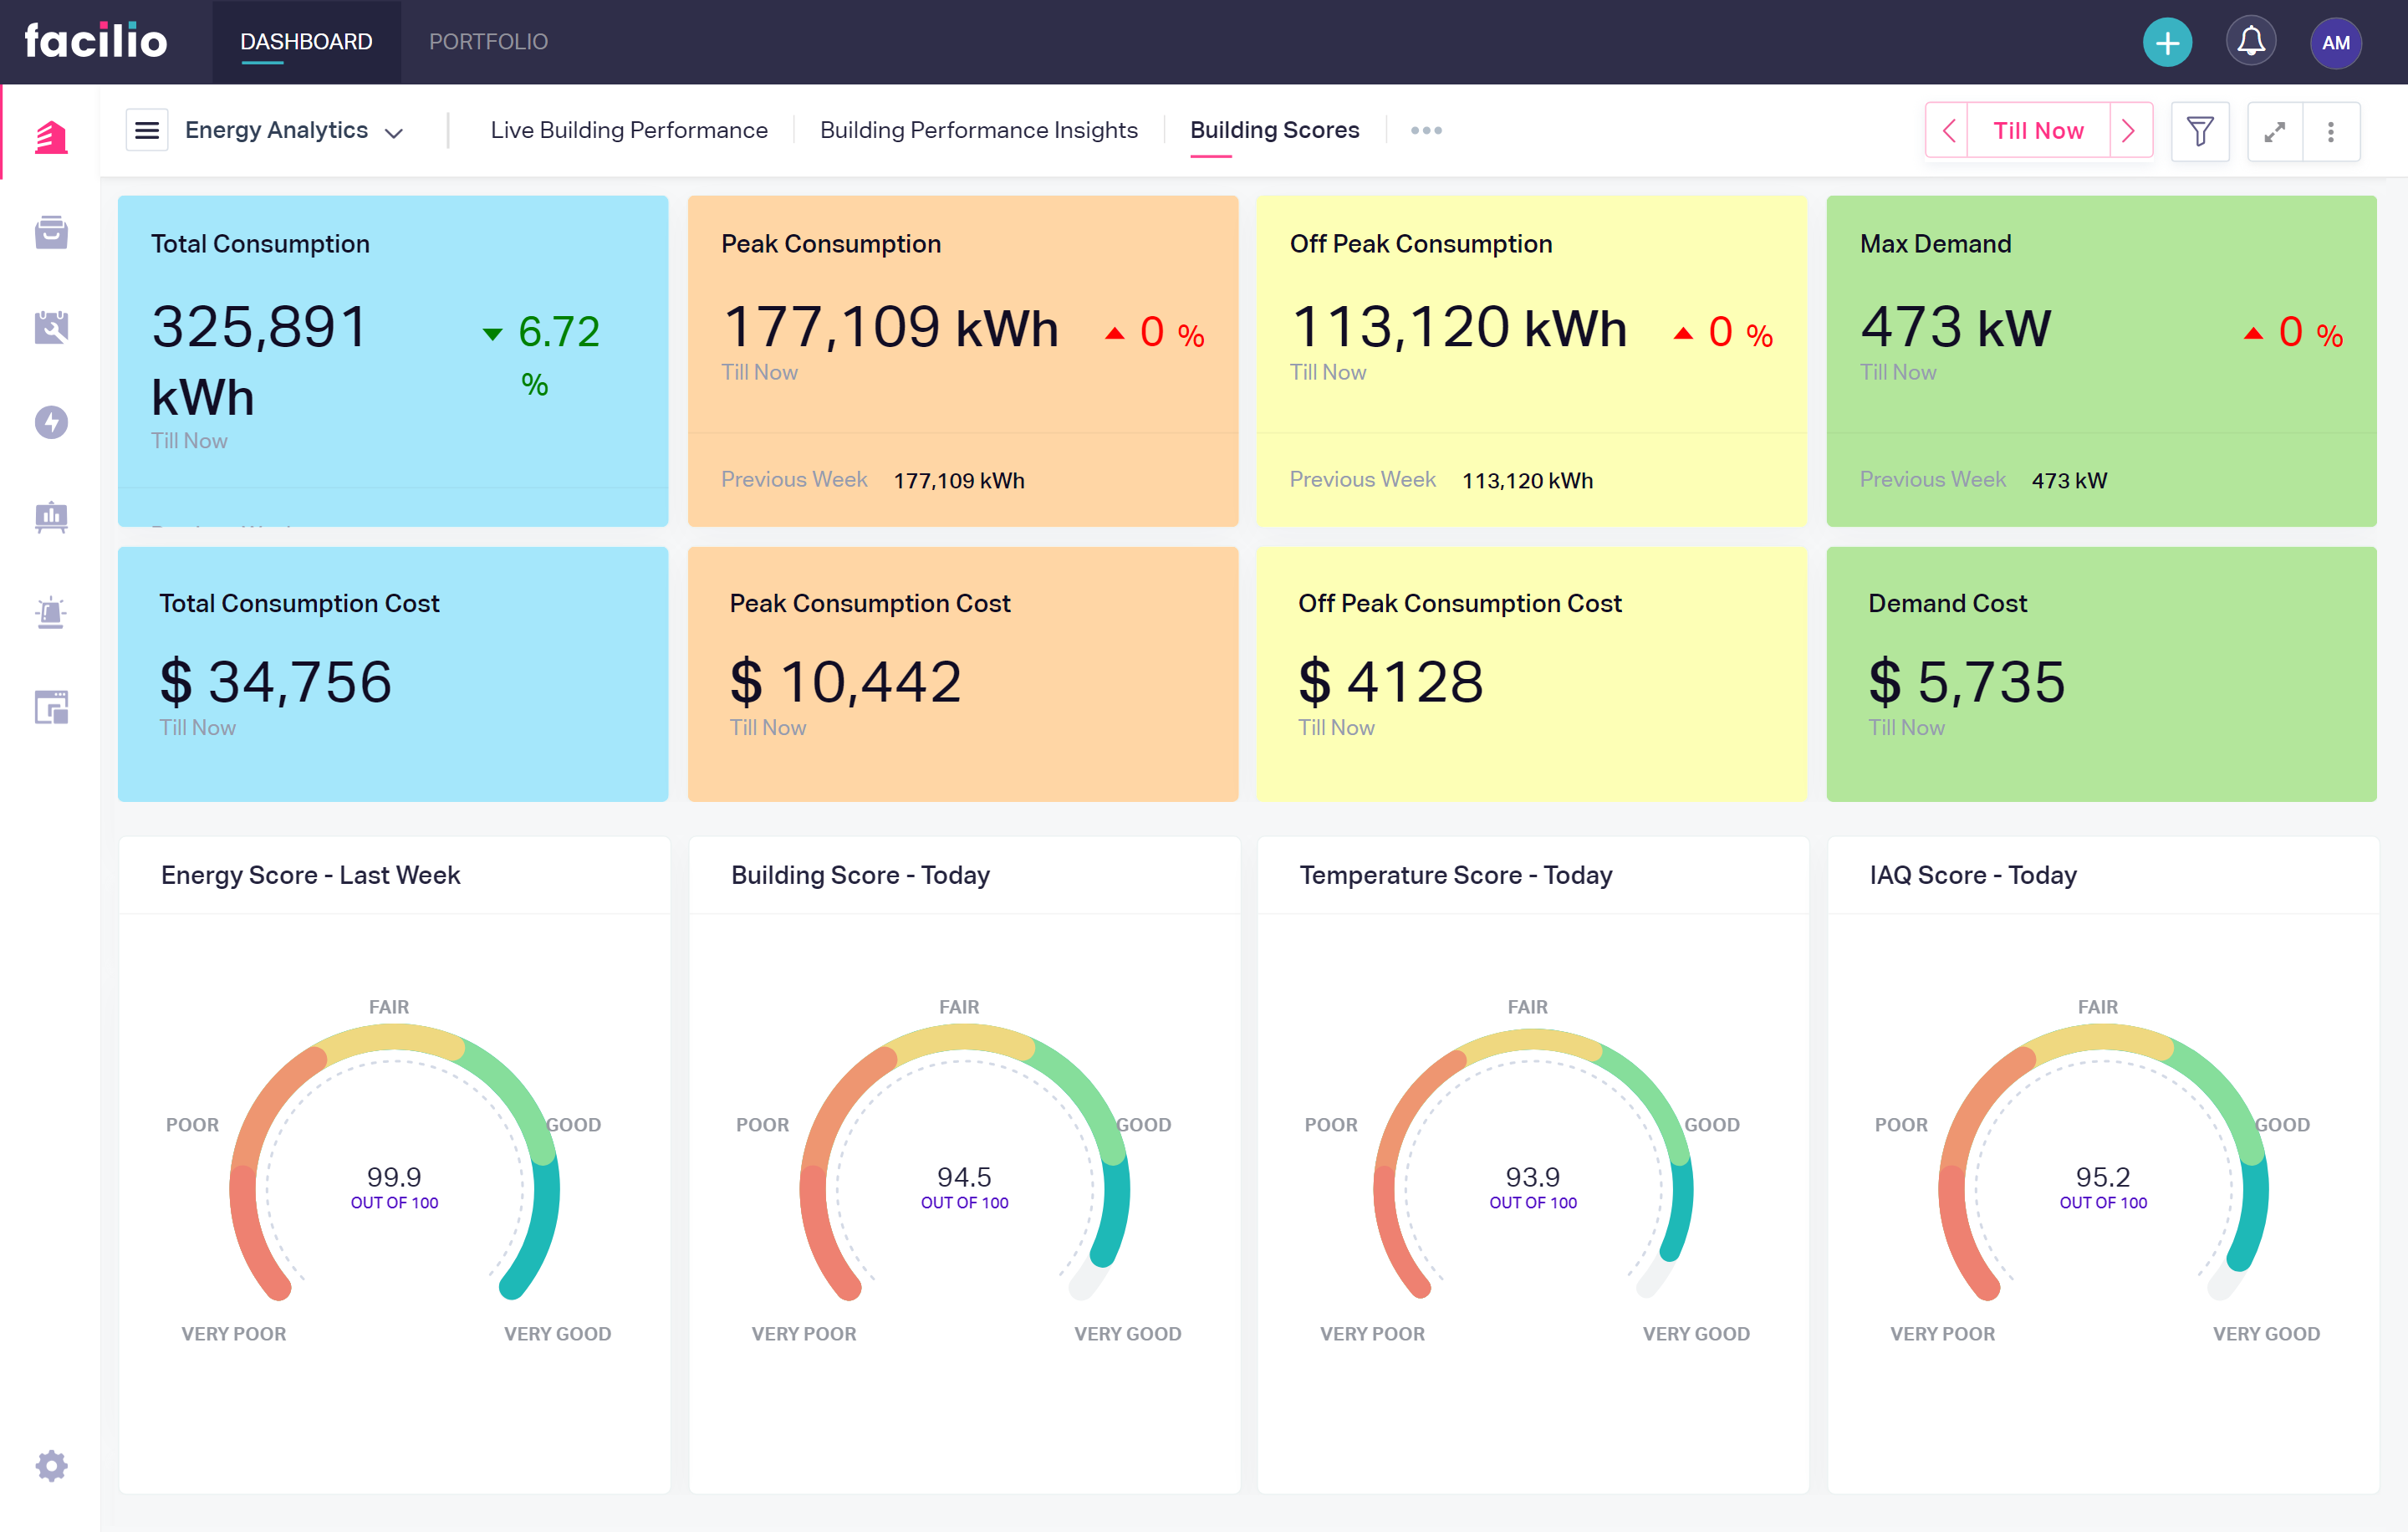
Facilio's utility bill analysis identified key factors driving utility costs, such as building demand, consumption, and peak hours. A dashboard with data on weekly consumption, peak and off-peak consumption, and max demand for the week was implemented, along with comparing long-term vs short-term changes. By this, the campus could track the increase in demand every week and the cost of those changes. Four energy meters gather this data and enable tracking energy consumption based on space and time period. Hence, the campus achieved improved energy management and substantial cost savings through real-time monitoring. For example, The campus had a high demand during Jan, and by using Facilio's platform, the campus took proactive measures based on the insights provided and modified their utility usage, which led to a reduction in the bill amount for the entire year.

Boosting energy efficiency with advanced energy analytics
Facilio's advanced energy analytics empowered the campus to compare current and historical building performance, optimize chiller operations based on occupancy and identify areas for improvement, resulting in cost savings and improved sustainability. There is also a scoring system for temperatures and CO2 telemetry data, and these scores are further broken down based on asset types and displayed as charts that point out the worst-performing areas in the building.

Streamlined maintenance with proactive fault detection and diagnostics
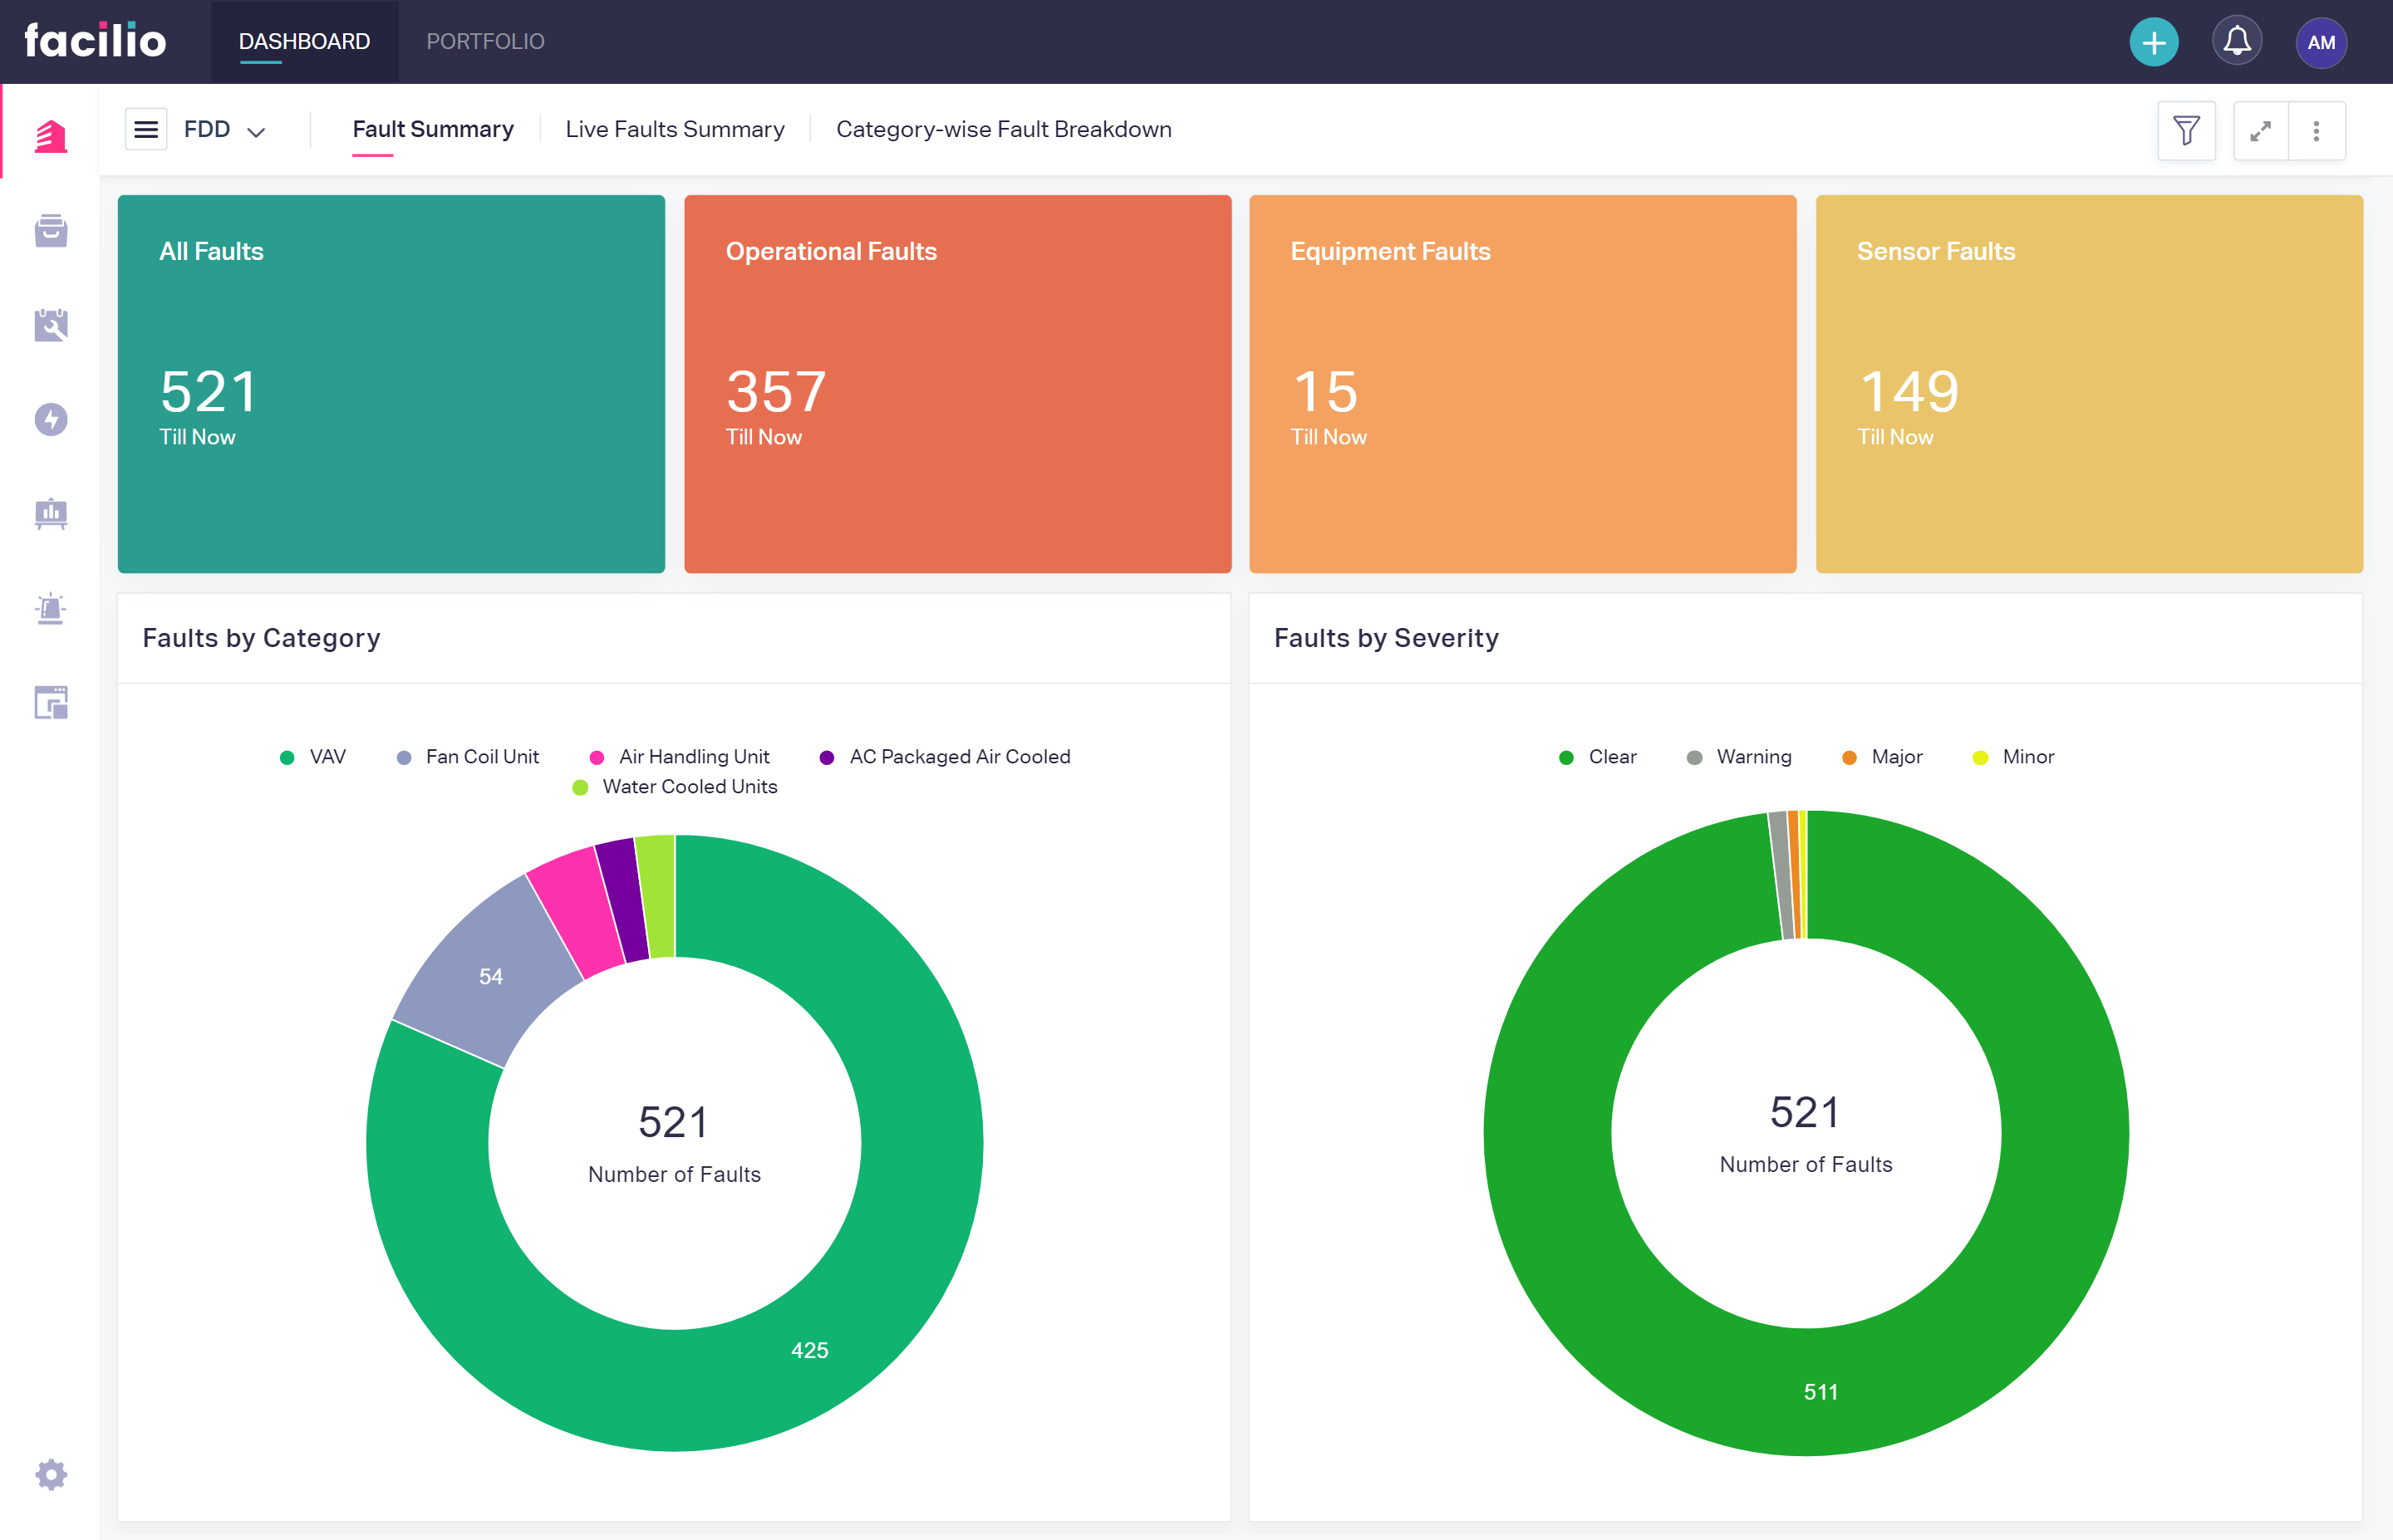
Facilio's FDD solution equipped the campus with weekly fault summaries, prioritized severity, enhanced maintenance management, and proactive issue resolution. Facilio's FDD solution was used to effectively identify the peak consumption trends using root cause analysis. Along with that, the FDD is also used to perform the cost impact assessment. The above actions are performed based on the cooling in the building, sensor errors, deviation from a standard sequence of operation, and several other parameters. For example, The FDD engine can set a threshold of 440KW. On breaching this threshold, the technicians will be alerted, and they can perform the necessary energy-saving measures.

Impact
- Improved HVAC operations leading to occupant comfort and increased visibility into building performance and consumption patterns.
- Real-Time monitoring and data-driven insights for proactive management of building performance.
- Significant reduction in utility costs and potential energy savings of 5 - 10%
- Enhanced operational efficiency with the identification of significant issues through Fault Detection & Diagnostics
- Identified chiller turn-on times (6.45 AM and 7.15 AM) to control initial power surge and reduce costs


