Identifying Safety Risks
As a result of configuring safe limit, you can identify the instances of a datapoint crossing the bounded value. When the safe limit is configured for a reading, a safety line appears on the chart (in the Analytics module) with reference to the reading as shown below.
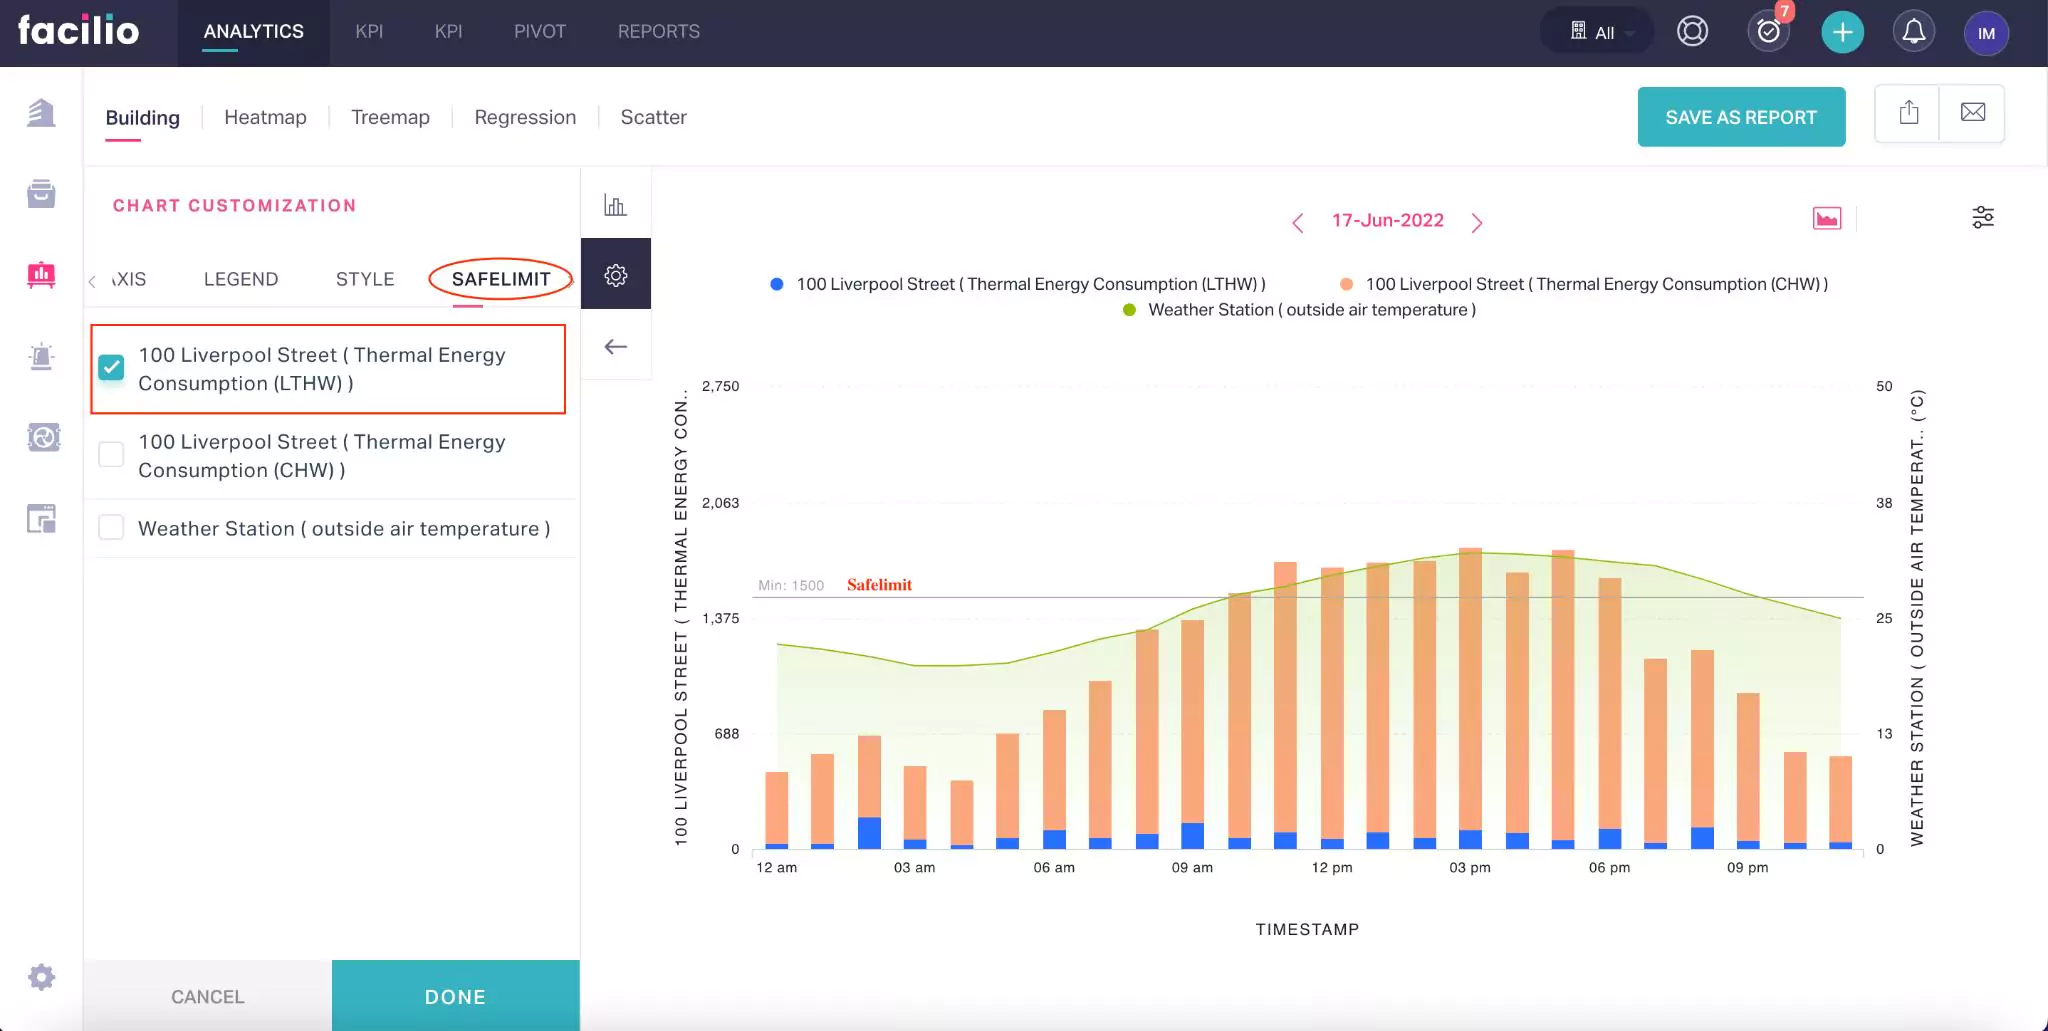
Note: Ensure that the safe limit is enabled for the selected readings as a part of the chart settings as shown above.
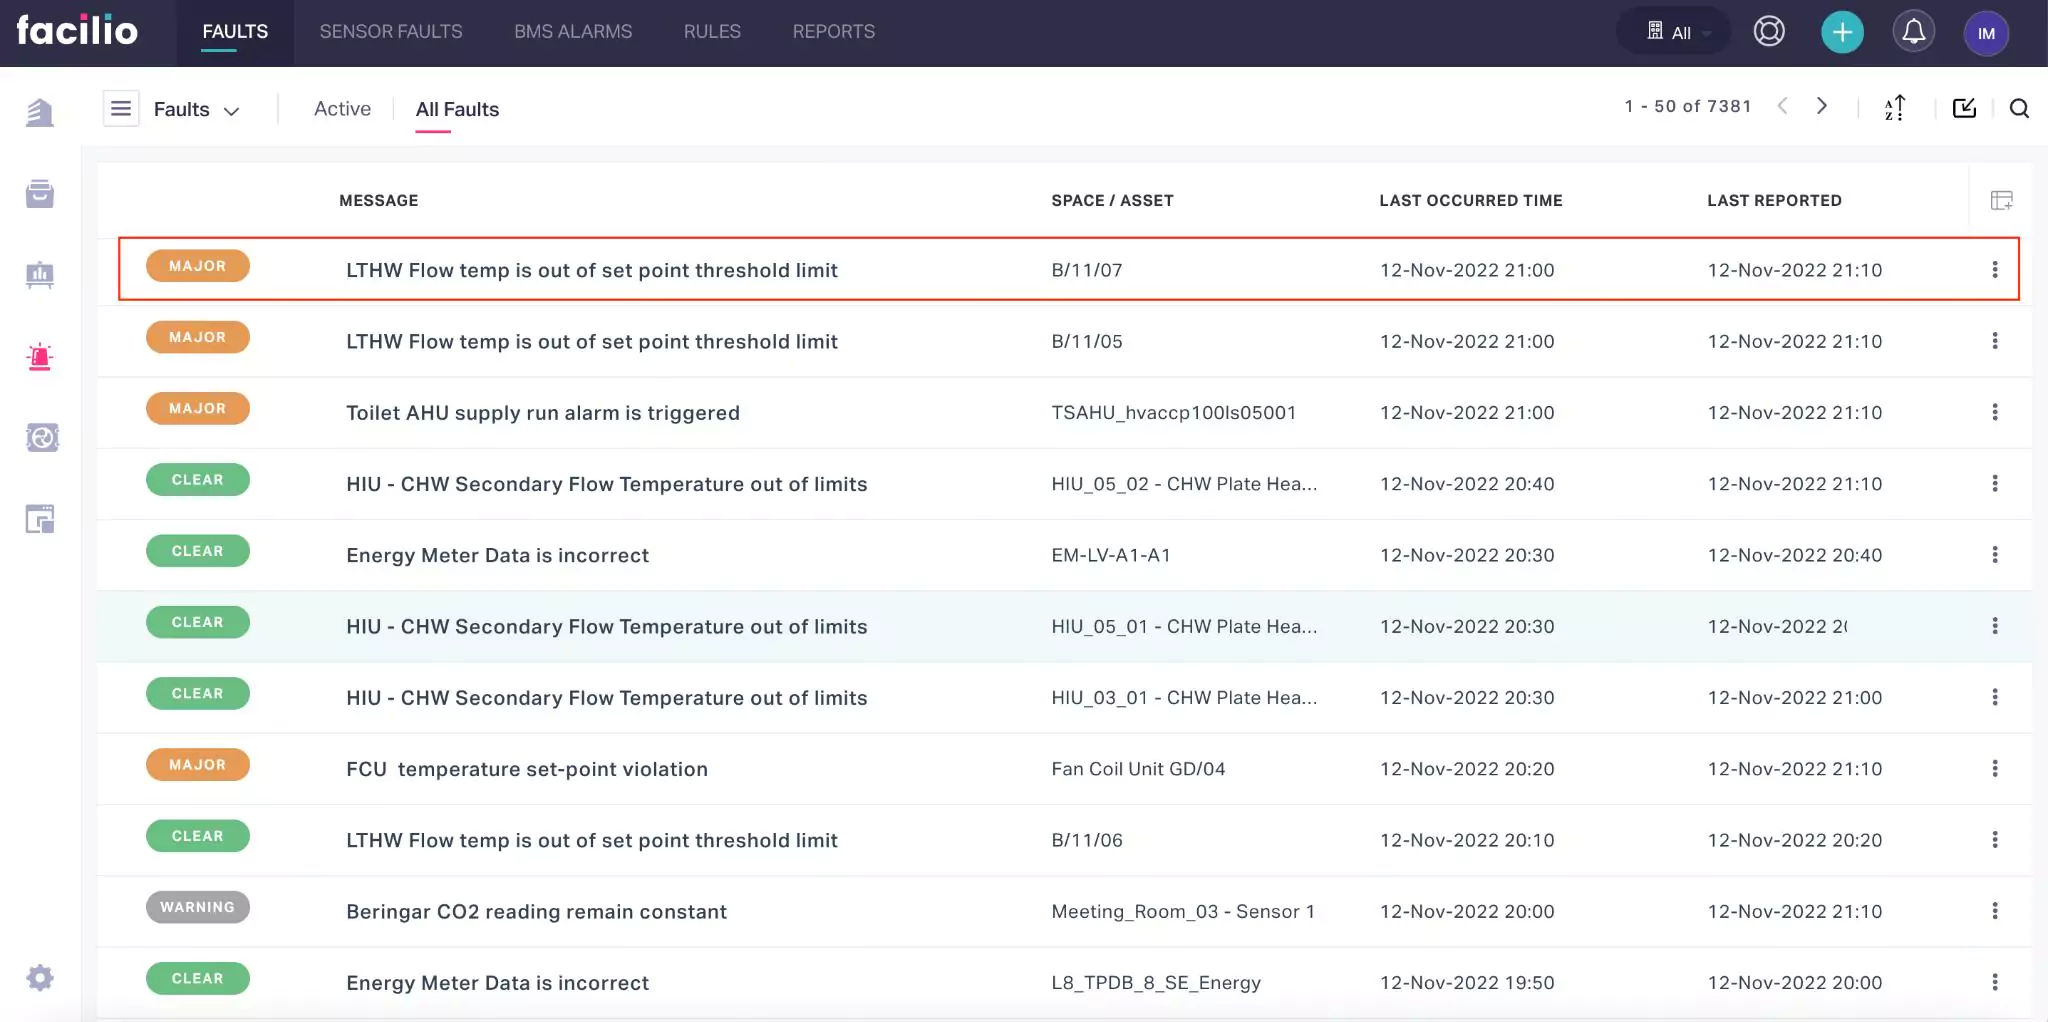
In addition, alarms are triggered (in the Diagnostics module) to indicate the fault or notify the risky instance, as shown below.